Wish the rest of you could have some of it. Our rivers are flooding.


Wish the rest of you could have some of it. Our rivers are flooding.

Actual monthly mean average temperature in Grand Rapids vs. average monthly mean since 1892:
November 2025: 38.7 F vs. 39.1
December 2025: 26.0 F vs. 28.5
January 2026: 20.2 F vs. 23.8
Totals: 84.9 vs. 91.4 = -6.5 degrees F or 7.1% colder.
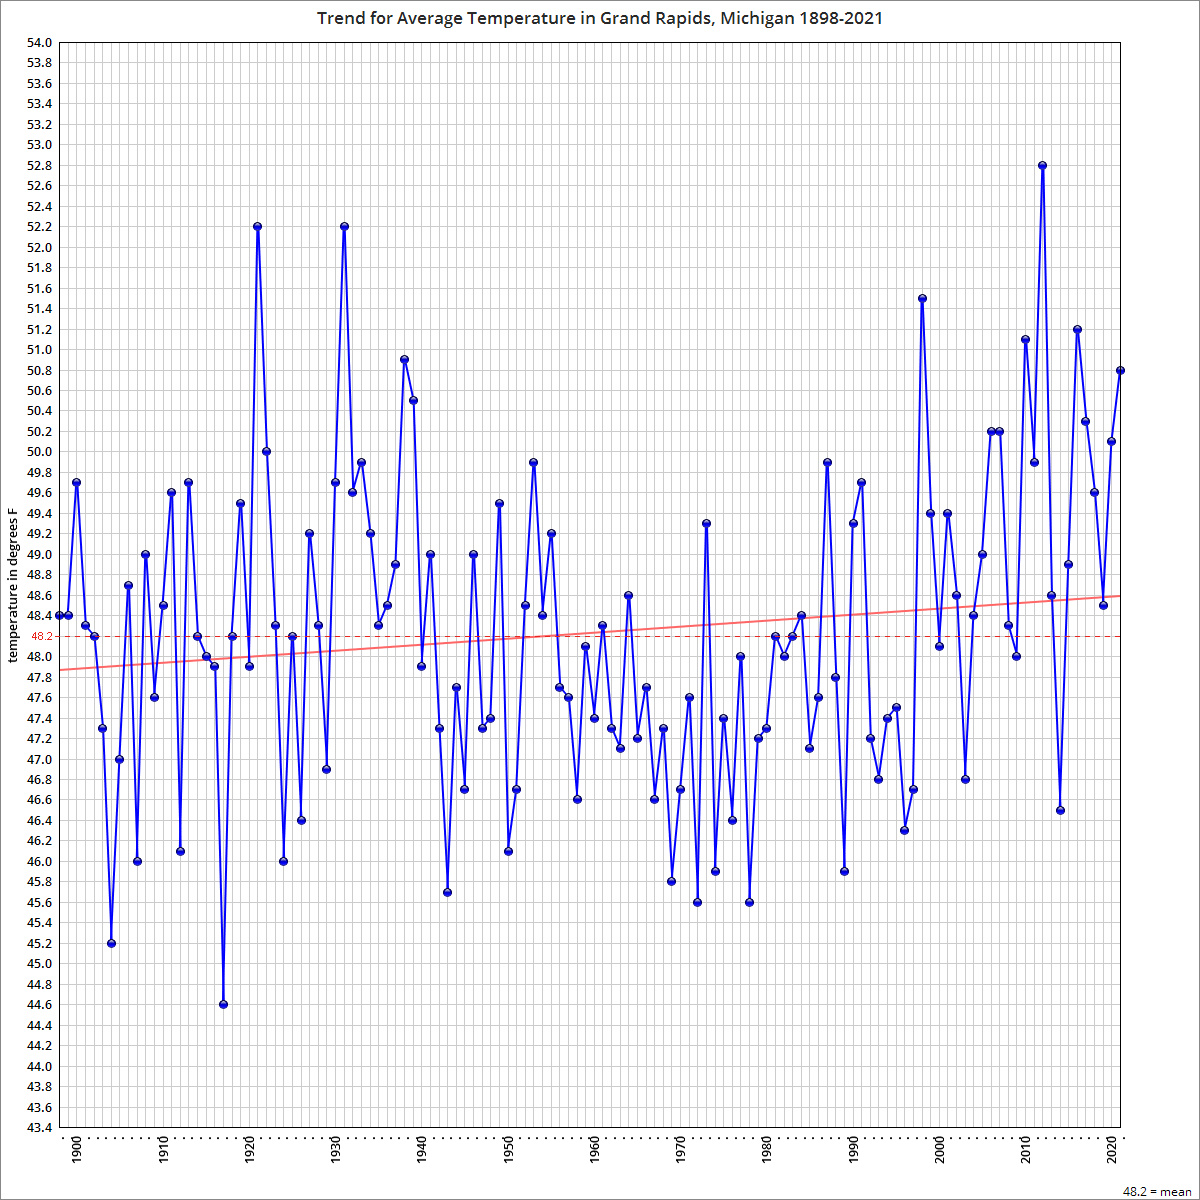
On an annual basis just a handful of years since 1999 have been at or lower than average temperature of 48.1 F:
The trend is colder by almost 2 degrees F for lowest minimum temperature over 129 years at KGRR.
This chart shows, like the charts for heating degree days or average temperature discussed earlier, the boat anchor for temperature which is 1943-1997. The anchor is heavy enough to keep the mean minimum since 1963 lower than before it, at -9F vs. -6F, despite all the recent warming.
Mean lowest minimum temperature:
1896-1943: -5F (48yrs)
1943-1997: -10F (55yrs)
1997-2024 to date: -5F (28yrs).

Wetter!
The long term trend for the Oceanic Nino Index is thought to be predictive of this wetter outcome in the Upper Midwest. The index trend is cooler from about +1 degree F anomaly to -1 degree F anomaly since 1951.
Mean annual precipitation at KGRR has risen from 31.88 inches 1903-1951 to 36.81 inches 1951-2023.

Tuesday’s global average temperature was calculated by a model . . . to estimate daily average temperatures starting in 1979.
“This is our ‘best guess’ of what the surface temperature at each point on earth was yesterday,” [Paolo Ceppi] said.
WaPo, of course.
Meanwhile, back in the real world of actual measurement, the highest maximum at KGRR so far in 2023 was 91 degrees F, on three days in June.
And the hottest 4th of July was way back in 1911. Yesterday made it to 89.
Maximum temperature observed has been in decline here for decades.


Could be just a heat island effect from KGRR.


Climate Update for KGRR: 1Q2023 since 1892

Mean average temperature in Grand Rapids, Michigan since 1892: 48.2 degrees F.
Mean average temperature in 2022: 48.7.
That is all.
2022 mean average temperature eleven months through Nov = 50.4
Mean average temperature through Nov since 1892 = 50.0
28 inches of snow, second highest November on record, all melted now.

We've been busy around here with three days in a row of 7+ inches of snow each, and in excess of two feet in five days.
Total November snow is already at 27.3 inches, which beats November 1951 at 26.9.
The snowiest November of all time at KGRR was November 2014 with 31 inches.
It was 75 degrees F here in Grand Rapids on November 10.
We dropped to 18 F last night.
Record November snow in Buffalo was 45.6 inches in November 2000. The second snowiest November was 31.3 inches in November 1976.
BUF is officially at 36.9 inches already through the 19th, also making November 2022 its second snowiest November ever, with ten more days left in the month.
Its three-day history is 9.4, 5.7, and 21.5 inches yesterday.
It was 79 F in Buffalo on the 5th, and dropped to 23 F in Buffalo last night.
The three day history for KGRR shows that the high on the 19th was 88 degrees F at numerous points throughout the afternoon and evening, and that the low was 71 degrees F early in the morning, but if you look at the daily data for a month it says the high was 90 degrees F and the low was . . . 49 degrees F.
The mean minimum for July going back to 1892 is 49 degrees F, so that explains that error. Some idiot transcribed that value instead of the actual value. So far this month, the lowest minimum was 52 degrees F.
Can't explain the 2 degree F discrepancy for the high, though. You would think that there would be room for a spike up to 90 during an hour interval by the presence of at least one 89 value at some regular hourly interval, but there isn't one.
Is someone's fat finger on the scale over there?
It's a good reminder that the human element introduces error into the record, whether intentional or not, and that you can't believe everything you're told, even about the simplest of things.
By the way, I'm just four miles from the station as the crow flies, and we had a rain shower last night which doesn't show up in the three day history either.
I know, I know, aLl wEaThEr iS LoCaL.


Climate Update for KGRR: 2Q2022

Spring was just 1.2% warmer than the mean by average temperature, on the strength of slightly higher highs and higher lows, and only 3% wetter than usual.
Average Temperature: 58.1
Mean Average Temperature: 57.4
Rain: 10.68
Mean Rain: 10.37
Snow (official season end +6.6%): 71
Mean: 66.6
Heating Degree Days (official season end -6.2%): 6282
Mean: 6694
Cooling Degree Days through June: 250
Mean: 184
Maximum temperatures vs. mean in 2Q
Apr: 82/79
May: 87/86
Jun: 95/91
Minimum temperatures vs. mean in 2Q
Apr: 23/22
May: 36/32
Jun: 45/43
Climate Update for KGRR: 1Q2022
Winter was 1.5% colder than the mean by average temperature, 1% colder by heating degree days, 44% wetter, and 25% snowier.
The trend line after 123 years of data shows average temperature in Grand Rapids, Michigan, rising 0.7 degrees F, or 0.388 degrees C, 65% less than the 1.1 degrees C claimed for the world by the United Nations Intergovernmental Panel on Climate Change yesterday.
And the minimal warming in Grand Rapids may in fact be misleading. Five of the data points in those top eight are from the last twenty-five years, during which increasing development around the KGRR measuring station may well be contributing heat island effects.
Yesterday's predicted high was 50 degrees F.
It made it to 38.5 on my device not far from the airport right around 5PM last night. I only cared about it because I was earnestly expecting the warm temperatures to make it easier on me while I pumped some standing water from a low spot on my property.


Climate Update for KGRR: November 2021

Official forecast right now for tonight:


