Showing posts with label climatology graphs for Grand Rapids Michigan. Show all posts

Wednesday, February 21, 2024

Trend for lowest minimum temperature in Grand Rapids, MI 1896-2024

The trend is colder by almost 2 degrees F for lowest minimum temperature over 129 years at KGRR. 

This chart shows, like the charts for heating degree days or average temperature discussed earlier, the boat anchor for temperature which is 1943-1997. The anchor is heavy enough to keep the mean minimum since 1963 lower than before it, at -9F vs. -6F, despite all the recent warming.

Mean lowest minimum temperature:

1896-1943: -5F (48yrs)

1943-1997: -10F (55yrs)

1997-2024 to date: -5F (28yrs).


Wednesday, February 7, 2024

Trend for annual heating degree days in Grand Rapids, Michigan 1904-2023

The mean for annual heating degree days has dropped about 63 HDD from 1904-1963 at 6726 shown, to 6663 for 1963-2023, or 0.94%. 

In the last 23 years, just 5 have been at or above the old mean shown, while 18 have been below. In the previous 23 years the pattern was much more even: 13 above the old mean shown and 10 below.

This is clearly a picture of recent moderating winters, but people forget that this comes on the heels of a prolonged period of much more severe winter cold extending 55 years from 1943-1997. During that period there were 40 winters above the old mean shown, and just 15 below it.

That cold period itself followed upon a previous period of previously well known warming where about 58% of the seasons in the record saw heating demand well below the old mean.

The Dust Bowl era. Maybe you've heard of it.

Higher mean heating degree day totals in the second half of the 20th century indicate its colder conditions compared with the eras book-ending it:

1904-1943: 6685 (40yrs)

1943-1997: 6883 (55yrs)

1997-2023: 6351 (27yrs).


Trend for annual mean average temperature in Grand Rapids, Michigan 1898-2023

The mean has risen 0.1 degrees F 1898-1963 at 48.2 shown, to 48.3 1963-2023, which is 0.2%.

The uptrend traverses about 0.9 degrees F over 125 years.

Planet's on FIRE lol.

Could easily be just heat island effect. The mean for average temperature is definitely warmer since 1997:

1997-2023: 49.4 (27yrs)

1943-1997: 47.5 (55yrs)

1898-1943: 48.4 (46yrs).

The relatively colder second half of the 20th century remains the noteworthy anchor of this graph's center.


Tuesday, February 6, 2024

Trend for annual precipitation in Grand Rapids, Michigan 1903-2023

 Wetter!

The long term trend for the Oceanic Nino Index is thought to be predictive of this wetter outcome in the Upper Midwest. The index trend is cooler from about +1 degree F anomaly to -1 degree F anomaly since 1951.

Mean annual precipitation at KGRR has risen from 31.88 inches 1903-1951 to 36.81 inches 1951-2023.


Wednesday, July 5, 2023

All you need to know about the hottest day ever

 Tuesday’s global average temperature was calculated by a model . . . to estimate daily average temperatures starting in 1979.

“This is our ‘best guess’ of what the surface temperature at each point on earth was yesterday,” [Paolo Ceppi] said.


WaPo, of course. 


Meanwhile, back in the real world of actual measurement, the highest maximum at KGRR so far in 2023 was 91 degrees F, on three days in June.


And the hottest 4th of July was way back in 1911. Yesterday made it to 89.


Maximum temperature observed has been in decline here for decades.


Thursday, September 8, 2022

Trend for annual precipitation in Grand Rapids, Michigan 1903-2021


The mean annual has risen to 34.79 through 2021 from 31.45 through 1963 . . . an extra 3.34 inches annually, in keeping with a long term slightly cooling Oceanic Nino Index from 1951.

Through 2021 mean precipitation for the eight months Jan-Aug is 22.88, but for Jan-Aug 2022 we've got 27.61 inches.

Wet. Wet. Wet.

Meanwhile out West it's the reverse.

Dry. Dry. Dry.


Tuesday, April 5, 2022

Average temperature in 2021 in Grand Rapids, Michigan, was the eighth highest on record in 124 years

The trend line after 123 years of data shows average temperature in Grand Rapids, Michigan, rising 0.7 degrees F, or 0.388 degrees C, 65% less than the 1.1 degrees C claimed for the world by the United Nations Intergovernmental Panel on Climate Change yesterday.

And the minimal warming in Grand Rapids may in fact be misleading. Five of the data points in those top eight are from the last twenty-five years, during which increasing development around the KGRR measuring station may well be contributing heat island effects.


Sunday, June 27, 2021

June 2021 to date is 2nd rainiest June ever in Grand Rapids, MI, and one of just 23 months since 1892 with 8 inches of rain or more, ranking 14th so far

June 2021 to date is the 14th rainiest month in Grand Rapids, MI, since 1892:
 
Jun 1892: 13.22
Sep 1986: 11.85
Apr 2013: 11.10
May 2001: 10.01
Oct 2017:  9.69
May 2000: 9.59
Sep 2008:  9.54
Sep 1981:  9.52
May 2004: 9.29
Sep 1961:  9.15
Jul 1992:   8.83
Aug 1987: 8.46
Jul 1950:   8.42
 
Jun 1-26, 2021: 8.40
 
Oct 1954: 8.32
Apr 1909: 8.29
May 1981: 8.29
Jun 1967: 8.21
Sep 1993: 8.20
Sep 1915: 8.11
Jul 1994: 8.07
Jun 2010: 8.04
Jun 1928: 8.03.
 

Among the 23 months with 8 inches of rain or more in Grand Rapids, MI, since 1892, June 24-26, 2021 stands out as one of just five 2-3 consecutive day rain events with 5.5 inches or more:

May 10-11, 1981: 6.51 inches of rain
Sep 9-11, 1986:    6.43
 
Jun 24-26, 2021:  6.17
 
May 14-16, 2001: 5.97
Jul 5-7, 1994:       5.54.
 
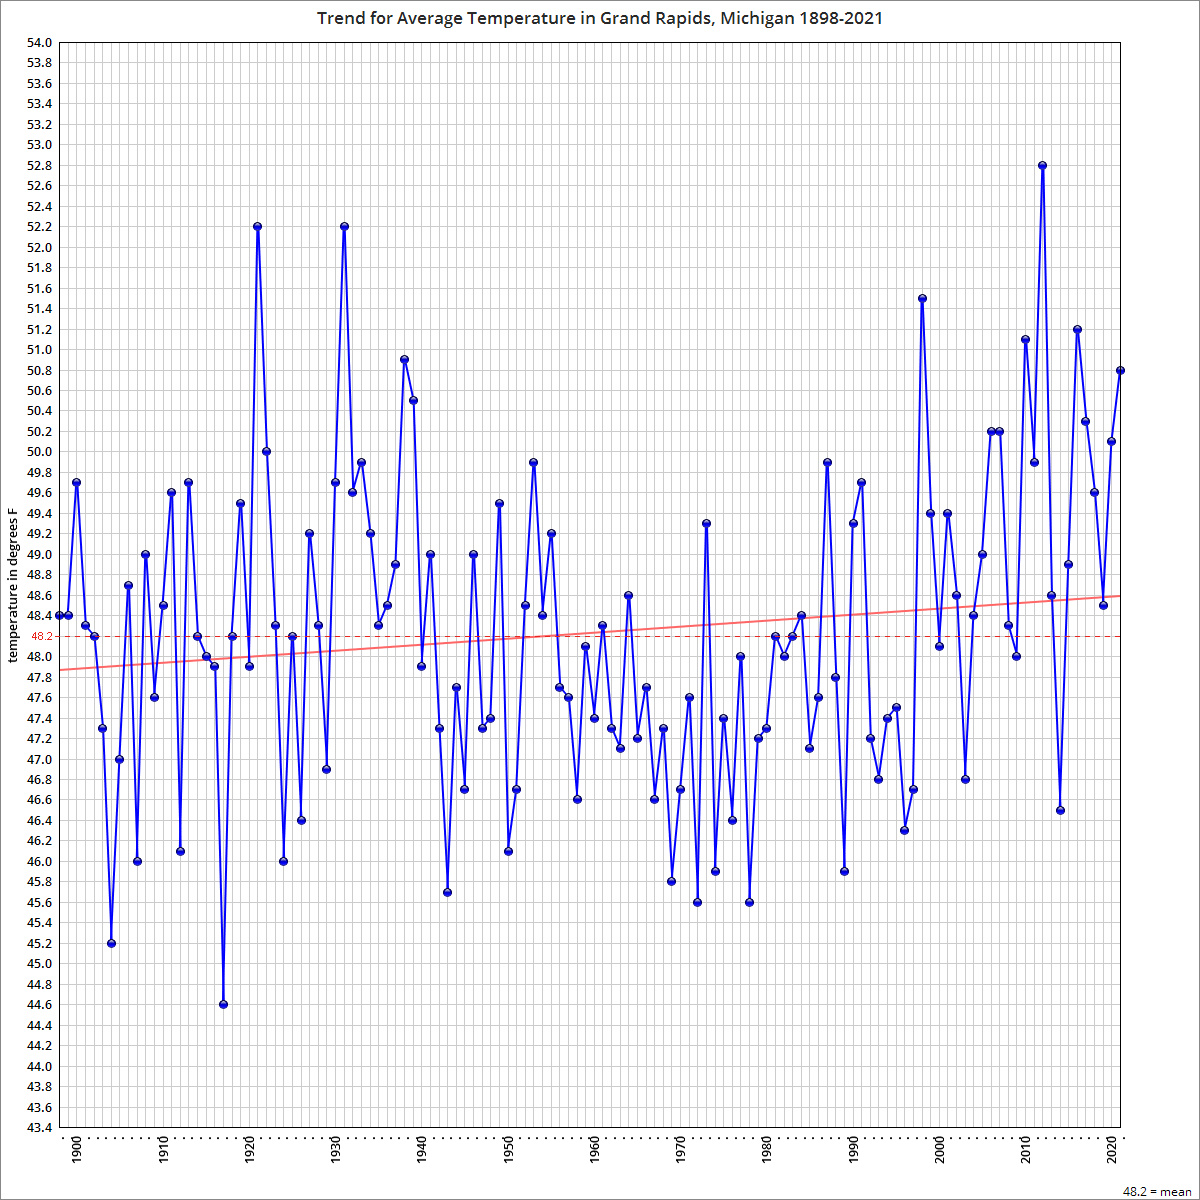
74% of the 23 months with 8 inches of rain or more in GR occurred after 1960, consistent with the higher rainfall trend generally in the graph below.
 
The June 2021 event caused a run on portable submersible pumps needed by homeowners to evacuate pooling water in low areas and basements due to saturated ground. Flood warnings remain in effect for the area through Monday.
 
Even so, Grand Rapids is still running over 2 inches behind on mean rainfall year-to-date.
 
June 26, 2021 ranks 7th for daily maximum rainfall on a single day in June since 1892 at 2.81 inches.
 
The most rain ever to fall on a single day in Grand Rapids is 4.22 inches, occurring on June 5, 1905 and again on August 19, 1939. Those extreme events are associated with the hotter, dryer pre-1960 half of the graph.
 
Mean annual daily maximum precipitation in GR is 2.27 inches, with June ranking the highest month at 1.29, followed by September at 1.26.


Tuesday, September 15, 2020

Given urban heat island distortions of +1 to +7 degrees F, average temperature rise of less than 0.3 degrees F above the mean since 1898 in Grand Rapids, MI is suspect

Given urban heat island distortions of +1 to +7 degrees F, average temperature rise of less than 0.3 degrees F above the mean since 1898 in Grand Rapids, MI is suspect (image D).

US EPA Heat Islands page:

"A review of research studies and data found that in the United States, the heat island effect results in daytime temperatures in urban areas about 1–7°F higher than temperatures in outlying areas and nighttime temperatures about 2–5°F higher. Humid regions (primarily in the eastern United States) and cities with larger and denser populations experience the greatest temperature differences. Research predicts that the heat island effect will strengthen in the future as the structure, spatial extent, and population density of urban areas change and grow".

The US Historical Climatology Network station in Grand Rapids, Michigan, looks increasingly compromised by urban heat island effects. It is located at the Gerald R. Ford International Airport (image A), where the main 8,500 foot runway did not become operational until 2001 and where 2 million passengers were not served for the first time until 2004.  

The weather station is located in the northwest corner of the 3,000 plus acre airport grounds at 4899 Tim Dougherty Dr, Grand Rapids, MI 49512 (image B). One can see it is now surrounded by industrial development to the north and west, the airport to the south and east, and a busy county road commission facility right east of the measurement station, which is accessed by a little walkway leading from the National Weather Service building (image C).

The county population has doubled in the last sixty years.

One can observe from the history of maximum temperature at the station (image E) that the trend is clearly lower by nearly 1.5 degrees F from the mean maximum over the whole period. The trend for minimum temperature is even lower, by over 2.0 degrees F from the mean (image F).

Click any image to enlarge.

A

B


C


D
E
F