Showing posts with label Oceanic Nino Index. Show all posts

Tuesday, February 6, 2024

Trend for annual precipitation in Grand Rapids, Michigan 1903-2023

 Wetter!

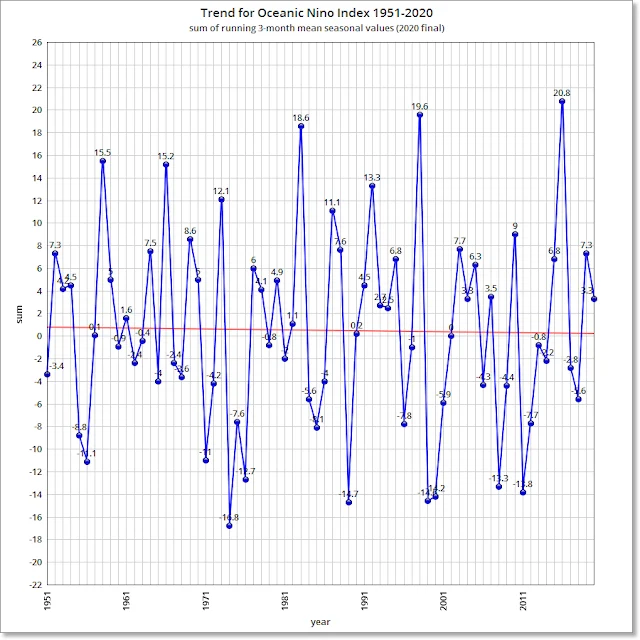
The long term trend for the Oceanic Nino Index is thought to be predictive of this wetter outcome in the Upper Midwest. The index trend is cooler from about +1 degree F anomaly to -1 degree F anomaly since 1951.

Mean annual precipitation at KGRR has risen from 31.88 inches 1903-1951 to 36.81 inches 1951-2023.


Trend for Oceanic Nino Index 1951-2023

 Long term trend is definitely cooler: La Niña.

Values for the first five measuring periods of the 2024 season are warmer, totaling +7.7: El Niño.


Wednesday, November 8, 2023

It's officially a moderate El Niño

 It's officially a moderate El Niño with five consecutive overlapping 3-month measuring periods averaging between +1.0 to +1.4, now averaging +1.04 after the fifth measurement in August-September-October.

It began with the April-May-June measuring period.

Wednesday, December 21, 2022

Half of the top 10 snowiest Decembers in Grand Rapids have occurred since 2007

 The result, no doubt, of the generally wetter conditions in the Great Lakes over the long haul as predicted by slightly cooler Pacific Ocean waters indicated by the Oceanic Nino Index.

We've had 14+ inches so far in Dec 2022 with 2 feet expected in the latest storm, so this December might break into the top 5. 

Winter. It's what's for Christmas.


Thursday, September 8, 2022

Trend for annual precipitation in Grand Rapids, Michigan 1903-2021


The mean annual has risen to 34.79 through 2021 from 31.45 through 1963 . . . an extra 3.34 inches annually, in keeping with a long term slightly cooling Oceanic Nino Index from 1951.

Through 2021 mean precipitation for the eight months Jan-Aug is 22.88, but for Jan-Aug 2022 we've got 27.61 inches.

Wet. Wet. Wet.

Meanwhile out West it's the reverse.

Dry. Dry. Dry.


Sunday, October 17, 2021

Oceanic Nino Index shows a moderate La Nina in the 2020-2021 year just past


The anomaly at or below -0.5 persisted for 10 out of 12 overlapping periods in the 2020-2021 measuring season. For the first two periods of the 2021-2022 measuring season the anomaly continues in the negative at sum -0.9. The deepest anomaly in the last season was -1.3 in the October-November-December period, which is considered neither weak nor strong, but middling.

The trend toward lower ONI values since 1951 is consistent with wetter conditions in the Upper Midwest of the US, and greater incidence of tropical storms in the Atlantic from the 1980s. There is no need to adduce "global warming":

the historical tropical storm count record does not provide compelling evidence for a greenhouse warming induced long-term increase.


Wednesday, November 14, 2018

The peers must be incompetent: Peer-reviewed ocean warming paper in premier journal found to have big math boo-boo

From the story here:

However, the conclusion came under scrutiny after mathematician Nic Lewis, a critic of the scientific consensus around human-induced warming, posted a critique of the paper on the blog of Judith Curry, another well-known critic.

“The findings of the ... paper were peer reviewed and published in the world’s premier scientific journal and were given wide coverage in the English-speaking media,” Lewis wrote. “Despite this, a quick review of the first page of the paper was sufficient to raise doubts as to the accuracy of its results.”

Co-author Ralph Keeling, climate scientist at the Scripps Institution of Oceanography, took full blame and thanked Lewis for alerting him to the mistake. ...

“Our error margins are too big now to really weigh in on the precise amount of warming that’s going on in the ocean,” Keeling said. “We really muffed the error margins.”

A correction has been submitted to the journal Nature.

Tuesday, August 1, 2017

Grand Rapids, Michigan, climate update for July 2017

Mean average temperature was 72.5 degrees F in July 2017 in Grand Rapids, Michigan. The mean is 72.2. The average to date is 50.0. The mean to date is 46.7.

The lowest minimum temperature was 53. The mean is 49.

The highest maximum temperature was 90. The mean is 94. July is the warmest month of the year by average temperature (above), so it's not going to be a very hot summer since it's all downhill from here.

Precipitation was 1.12 inches. The mean is 3.13.

Cooling degree days came to 240, which is the mean. The total to date is 432. The mean to date is 422.

I have corrected my climate update for June 2017. Either I or NWS reported incorrect figures for lowest minimum temperatures and for cooling degree days, not sure which. I noticed the discrepancy today and fixed it. May 2017 checks out OK.

The three month Oceanic Nino Index value has averaged -0.32 over the last eleven months, climbing to +0.5 in the last measurement period in April-May-June after a weak cooling event in the Pacific lasting five months.  

Wednesday, June 14, 2017

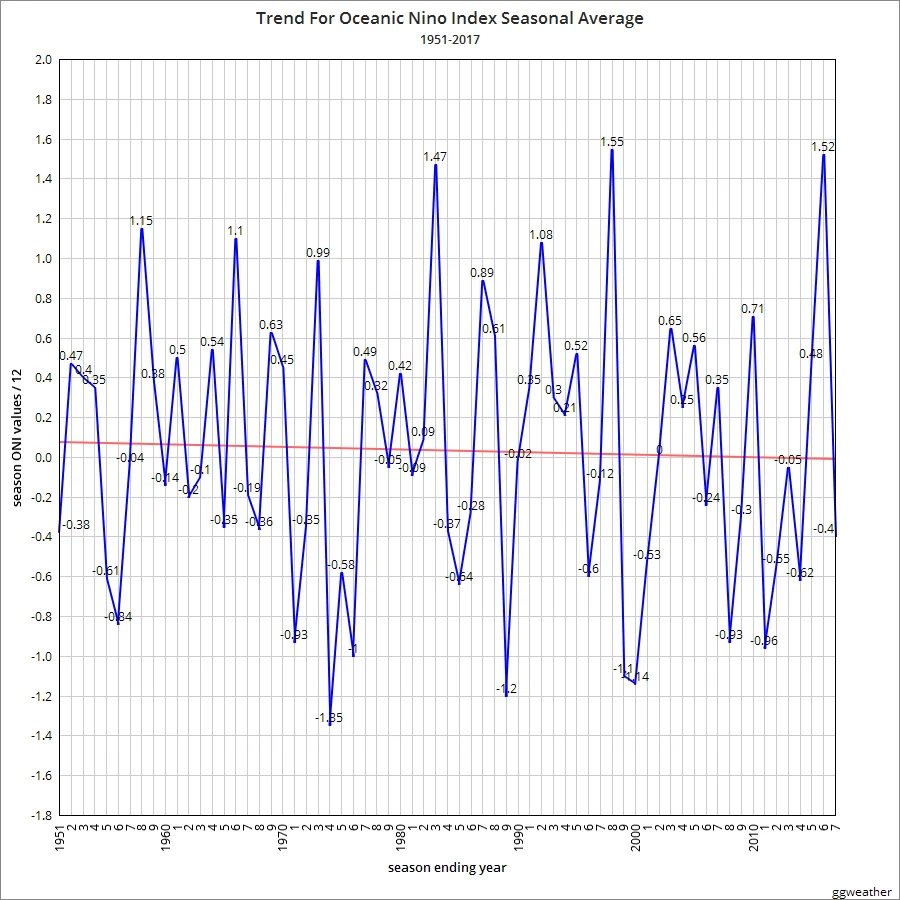
Full Oceanic Nino Index data trend shows the Pacific Ocean is definitely cooling slightly

Not quite 0.1 ONI value point since 1951. Data for 2017 shown is for ten months, all the rest twelve.


Friday, June 9, 2017

More than 30% of the earth's surface (Pacific Ocean) shows very slight cooling since 1951 on net

March period
June period
September period
December period

Sunday, December 4, 2016

November 2016 climate summary for Grand Rapids, Michigan

November 2016 climate summary for Grand Rapids, Michigan


Average temperature was 45.4 degrees F. Normal is 39.1. The month ranked 4th warmest November since 1892. The YTD average temperature was 53.4, the 4th warmest YTD average among the previous four warmest full years on record. The normal YTD average temperature is 50. The YTD average temperature in the hottest full year on record in 2012 was 54.4, in 1921 was 54.2, in 1931 was 53.7, in 2016 was 53.4 and in 1998 was 53.2 (the last three were all El Nino episodes).

The lowest temperature recorded this November was 21. The normal lowest temperature is 17. The highest temperature this November was 73. The normal highest temperature is 66.

November 2016 saw 3.24 inches of precipitation. Normal is 2.84. YTD precipitation is 43.33 inches, normal YTD is 31.94. The wettest full year on record was 2008 with 48.80 inches. The driest full year was 1930 with just 20.92.

Snowfall measured 0.8 inches. Normal for November is 6.4 inches. The seasonal total is 0.8 inches, and the normal seasonal total is 6.8. Normal seasonal snowfall is 66.7 inches. The snowiest season on record was in 1951-52 with 132 inches of snow. 1905-06 was the least snowy with 20.

There was no change to Cooling Degree Days in November. YTD there were 936 CDD, the 15th warmest on record so far. Normal CDD is 694.

Heating Degree Days totaled 44 in September, 324 in October and 580 in November for a total of 948 for the season so far. Normal HDD seasonally is as follows: July, 9, August, 19, September, 137, October, 427 and November, 770 for a seasonal normal to date of 1362. Normal for a full season is 6713 HDD. The coldest winter season by HDD was in 1903-04 with 7712. The warmest was in 2011-12 with just 5253.

Actual lower HDD presently have been indicative of the after effects of warmer conditions prevailing since the end of the El Nino this summer. The Very Strong El Nino of 2015-16, averaging 1.43 on the index and 15 months long, was longer but weaker than the 1997-98 episode, which averaged 1.56 on the index and was 13 months long. The 1982-83 VSE averaged 1.3 on the index and was 15 months long.

The Oceanic Nino Index value for the August-September-October measuring period was -0.7, the second consecutive measurement at -0.5 or lower. Five such values consecutively would indicate the onset of a La Nina, which could produce wetter conditions in the US High Plains and Upper Midwest and lots of snow in Canada.

No thanks. Been pretty wet in these parts already, Pilgrim.


Sunday, September 4, 2016

Grand Rapids, Michigan August 2016 climate summary: 11th warmest since 1892 by average temperature

Average temperature was 73.5 degrees F. Normal is 70.2. The month ranked 11th warmest since 1892. The hottest August by average temperature was in 1947 at 77.7. August 2016 was 5.4% cooler than that.

The normal 8-month average temperature is 49.6. Year to date the average temperature is 52.6, about 6% warmer than normal due to the El Nino, which ended with the April-May-June measuring period. The warmest full year on record by average temperature was 2012, at 52.8. The 8-month year to date average temperature in 2012 was 55.6, 5.7% warmer than the 2016 year to date. The May-June-July Oceanic Nino Index value has fallen to 0.2.

August 2016 was the second wettest on record with 7.97 inches of rain. Normal is 3.05. Year to date 31.54 inches of rain have fallen. Normal is 22.74. We're cutting grass.

Cooling degree days totaled 274 in August, 45% above the normal 189. By CDD August 2016 was tied for 13th warmest August on record. The warmest August by CDD occurred in 1947 with 404 CDD. August 2016 was 32% lower than that.

Year to date CDD totals 831, 36% higher than the normal 612 for the year to date. The record for highest annual CDD was set in 1921 at 1200, for lowest annual CDD in 1992 at 316. Normal annual CDD is 694. Year to date CDD is already almost 20% above the normal annual, with fewer than 100 CDD normally added in the remaining four months of the year. Air conditioning has been more than welcome this summer. 

Sunday, May 8, 2016

The back of the current very strong El Nino has been broken

After four consecutive measuring periods averaging 2.2 on the Oceanic Nino Index, the back of this current very strong El Nino (VSE) has been broken decisively by the last two measuring periods averaging 1.75.

The January-February-March period has been revised down from 2.0 to 1.9, followed by the initial reading for February-March-April coming in at 1.6.

To date this VSE has extended for thirteen periods still averaging 1.53, making it as long as the 1997-1998 episode but slightly weaker than its 1.56 average on the index.

If past experience is any guide, expect two or three more periods at 0.5 or above on the index before this VSE is finally over.

Currently about 34% of the nation is abnormally dry or worse. A year ago at this time almost 56% of the country was abnormally dry or worse. That's an almost 40% improvement in drought conditions thanks to El Nino rains.

Early May 2016
Early May 2015

Wednesday, February 10, 2016

The current El Nino now qualifies as a very strong one, but not as severe as 1997-98

The current El Nino now qualifies as a very strong one because there have been three consecutive measuring periods at 2.0 or greater on the Oceanic Nino Index: 2.0, 2.2 and 2.3.

This is the third very strong El Nino since 1950.

For the current three month measuring period it averages 2.166, in the middle between the similarly measured 1982-83 El Nino averaging 2.033, and the 1997-98 episode averaging 2.266.

The latter event was 11.5% more severe in the current three month period than the '82-'83 episode, and the current event is only 6.5% more severe.

The 1982 episode lasted fifteen months and averaged 1.3 on the index, the 1997 episode lasted thirteen months and averaged 1.56, and the current episode is now ten months in duration averaging 1.41.

Sunday, December 27, 2015

The 2015 El Nino to date in perspective

Using the Oceanic Nino Index here the strong to very strong El Ninos of the past can be summarized like this, showing the 2015 El Nino to be so far most like 1972-73:

1957-58, 16 consecutive months, 1.0 average severity
1965-66, 11 consecutive months, 1.2 average severity
1972-73, 12 consecutive months, 1.2 average severity (One 3-month mean reading at 2.0)
1982-83, 15 consecutive months, 1.3 average severity (Three consecutive 3-month mean readings averaging 2.1)
1997-98, 13 consecutive months, 1.6 average severity (Five consecutive 3-month mean readings averaging 2.2)

2015 to date, 8 consecutive months, 1.2 average severity (One 3-month mean reading at 2.0).


At this hour in Grand Rapids we have 38 degrees F and no snow whatsoever.