Showing posts with label Climate 2017. Show all posts

Saturday, December 30, 2017

Yahoo and HuffPo call this "normal" winter weather: It's not

Here. But hot summer temperatures evoke global warming headlines. 

The mean monthly lowest minimum temperature in Grand Rapids, Michigan in Decembers is +4 F. With today and tomorrow to go, we're already at - 12 F, the third coldest on record.

Average temperature in December 2017 so far ranks 32nd coldest out of 126 Decembers, the 75th percentile. Normal would be the 50th percentile. So it's definitely colder than normal, while not absolutely record setting.

Climate shmimate. These idiots can't predict bupkis three days out let alone from month to month and century to century. All year long average temperature has been running warm, until December ruined their little global warming narrative.

Bwaaaaaaahahahahaha.

Sunday, December 3, 2017

Grand Rapids, Michigan, climate update for November 2017

Grand Rapids, Michigan, climate update for November 2017

Max Temp: Actual 63, Mean 66
Min Temp: Actual 17, Mean 17
Av Temp:   Actual 38.6, Mean 39.1, YTD Actual 52.7, YTD Mean 50.0
Precip:       Actual 2.8, Mean 2.84, YTD Actual 37.47, YTD Mean 32.1
CDD:         Actual 0, Mean 0, YTD Actual 719, YTD Mean 694
HDD:         Actual 784, Mean 770, YTD Actual 1191, YTD Mean (through 2016-17) 1358

Average temperature year to date is running 5.4% ahead of mean to date.

The warmest years on record here in Grand Rapids were considerably warmer at the same penultimate stage.

In the warmest full year on record by average temperature, 2012, average temperature year to date was 54.4, 1.70 ahead of 2017 year to date and 8.8% ahead of 2017 mean to date.

In the second warmest full year on record, 1931, average temperature year to date was 53.7, 1.0 ahead of 2017 year to date and 7.4% ahead of 2017 mean to date.

In the third warmest full year on record, 1921, average temperature year to date was 54.2, 1.5 ahead of 2017 year to date and 8.4% ahead of 2017 mean to date.

The cooling need during the warm season was 3.6% above the mean.

The warming need thus far into the cool season is running 12.3% under the mean. Seasonably cold temperatures are finally predicted to arrive on Tuesday.

Wednesday, November 1, 2017

Climate update for Grand Rapids, Michigan, October 2017

Grand Rapids, Michigan, climate update for October 2017

Max Temp: Actual 82, Mean 79
Min Temp: Actual 28, Mean 28
Av Temp:   Actual 55.2, Mean 51.3, YTD Actual 54.06, YTD Mean 51.08
Precip:       Actual 9.69, Mean 2.98, YTD Actual 34.67, YTD Mean 29.26
CDD:         Actual 11, Mean 8, YTD Actual 719, YTD Mean 693

Average temperature is running 5.8% ahead of mean to date.

The warmest years on record here were considerably warmer at this stage.

In the warmest full year on record by average temperature, 2012, average temperature year to date was 55.84, 1.78 ahead of 2017 year to date and 9.3% ahead of mean to date.

In the second warmest full year on record, 1931, average temperature year to date was 54.35, 0.29 ahead of 2017 year to date and 6.4% ahead of mean to date.

In the third warmest full year on record, 1921, average temperature year to date was 56.00, 1.94 ahead of 2017 year to date and 9.6% ahead of mean to date. 

Sunday, October 1, 2017

Grand Rapids, Michigan, climate update for September 2017

Max Temp: Actual 96, Mean 89
Min Temp: Actual 41, Mean 37
Av Temp:   Actual 66.5, Mean 62.7, YTD Actual 53.9, YTD Mean 51.1
Precip:       Actual 0.66, Mean 3.55, YTD Actual 24.98, YTD Mean 26.28
CDD:         Actual 136, Mean 75, YTD Actual 708, YTD Mean 685

In short year to date we are slightly warmer and dryer than the mean.

Average temperature is running 5.5% ahead of mean and cooling degree days about 3.4% ahead of mean. The rain deficit is running about 4.9% behind the mean. For average temperature year to date, compare some of the hotter years 2012 at 56.4, 1931 at 54.2 and 1921 also at 56.4, the average of which is 55.7. We are still 3.2% cooler than that in 2017.

Last season's average ONI value was -0.266, the lingering effects of the five month long Weak La Nina, indicating a very slightly cool ocean in the tropical Pacific over the last year. The preliminary read of the first value in the new season is -0.1.

Despite the heat wave we experienced in September, I still used 8% fewer kWh this September than last and stayed comfortably cool.

Wednesday, September 20, 2017

International Howler of the Day: Britain voted for Brexit yet Theresa May criticizes those who fail to respect international agreements

Having it every which way to Sunday she was.

From the story here:

Leaders who fail to respect international agreements risk jeopardising faith in institutions, she warned. Delivering a thinly-veiled rebuke to the US President, she said climate change “is depleting and degrading the planet we leave to our children”. And the PM hit out at countries which try to stifle global trade, after Mr Trump's “America first” inauguration speech in January. She warned against moves which “undermine support for the forces of liberalism and free trade that have done so much to propel global growth”. ... But Mrs May threatened to split cash from UN programmes that fail to produce results.

Saturday, September 2, 2017

Grand Rapids, Michigan, climate update for August 2017

The back of summer was broken last month, and August showed it:

Max Temp: Actual 88, Mean 92
Min Temp: Actual 47, Mean 47
Av Temp:   Actual 68.7, Mean 70.2
Precip:       Actual 1.72, Mean 3.04
CDD:         Actual 140, Mean 188.

The average of the last twelve ONI values is -0.266, the lingering effects of the five month long Weak La Nina, indicating a very slightly cool ocean in the tropical Pacific over the last year.

I used 22% fewer kWh this August than last, but stayed comfortably cool nonetheless.

Tuesday, August 1, 2017

Grand Rapids, Michigan, climate update for July 2017

Mean average temperature was 72.5 degrees F in July 2017 in Grand Rapids, Michigan. The mean is 72.2. The average to date is 50.0. The mean to date is 46.7.

The lowest minimum temperature was 53. The mean is 49.

The highest maximum temperature was 90. The mean is 94. July is the warmest month of the year by average temperature (above), so it's not going to be a very hot summer since it's all downhill from here.

Precipitation was 1.12 inches. The mean is 3.13.

Cooling degree days came to 240, which is the mean. The total to date is 432. The mean to date is 422.

I have corrected my climate update for June 2017. Either I or NWS reported incorrect figures for lowest minimum temperatures and for cooling degree days, not sure which. I noticed the discrepancy today and fixed it. May 2017 checks out OK.

The three month Oceanic Nino Index value has averaged -0.32 over the last eleven months, climbing to +0.5 in the last measurement period in April-May-June after a weak cooling event in the Pacific lasting five months.  

Monday, July 3, 2017

Grand Rapids, Michigan, climate update for June 2017

Mean average temperature was 69.5 degrees F in June 2017 in Grand Rapids, Michigan. The mean is 67.6.

The lowest minimum temperature was 46. The mean is 43.

The highest maximum temperature was 93. The mean is 91.

Precipitation was 4.88 inches. The mean is 3.55.

Snowfall was zero. Seasonal snowfall 2016-2017 ends at 60.1 inches. The mean is 66.6.

Heating degree days came to 22. The mean is 54. The season ends with 5635, the fifth warmest on record. The mean is 6703. Seasonal maximum is 7712. Seasonal minimum is 5253.

Cooling degree days to date come to 162. The mean to date is 139. Seasonal maximum is 1200. Seasonal minimum is 316. 

Wednesday, June 14, 2017

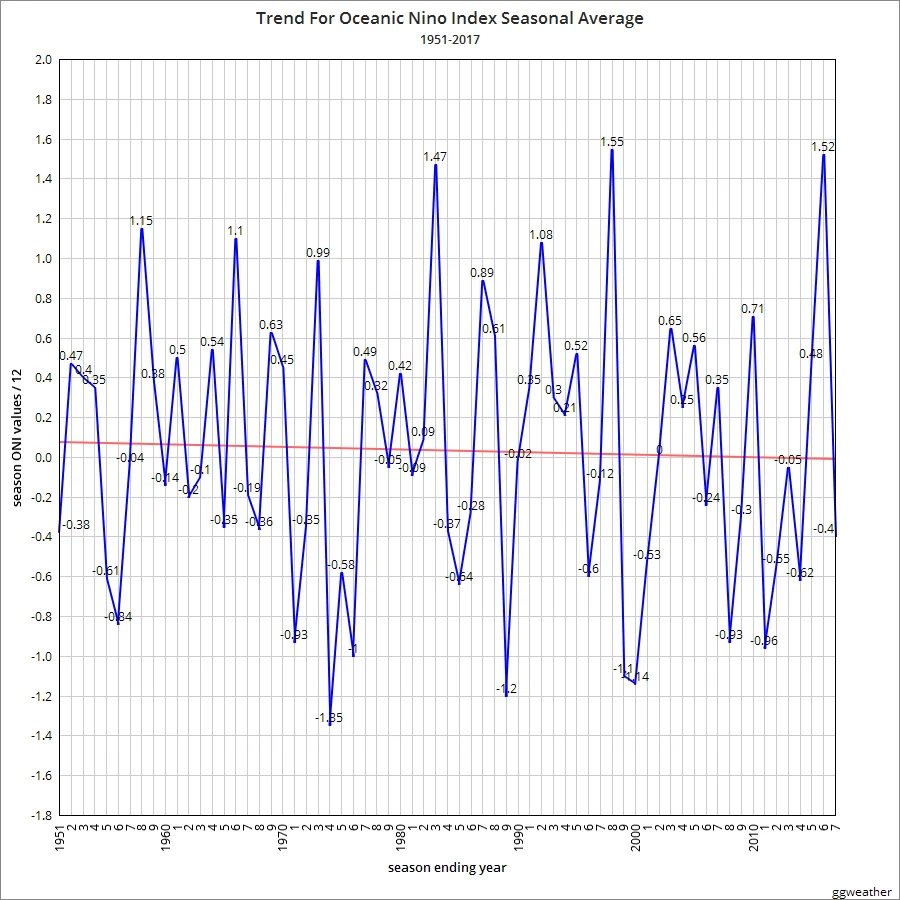
Full Oceanic Nino Index data trend shows the Pacific Ocean is definitely cooling slightly

Not quite 0.1 ONI value point since 1951. Data for 2017 shown is for ten months, all the rest twelve.


Friday, June 9, 2017

Sunday, June 4, 2017

NOAA's Climate at a Glance tool deliberately leaves out data going back to 1896 to misrepresent the Grand Rapids, MI, temperature trend

You can ask the Climate at a Glance tool for the data going back to 1896, but it won't give it to you:


But the data exists for Grand Rapids at the National Weather Service, from which I made this graph:


Friday, June 2, 2017

Grand Rapids, Michigan, climate update for May 2017

Mean average temperature was 57.6 degrees F in May 2017 in Grand Rapids, Michigan. The mean for May is 57.9.

The lowest minimum temperature was 31. The mean for May is 32.

The highest maximum temperature was 88. The mean for May is 86.

Precipitation was 1.5 inches. The mean for May is 3.44.  Fifteenth driest May on record.

May snowfall was 0.0 inches. The mean for May is 0.2.

Heating degree days came to 247. The mean for May is 252. The total through May from July 2016 comes to 5613 vs. mean to date of 6653. The heating season to date has been about 15.6% warmer than normal.

Trump correctly called the Paris Climate Accord a scheme to redistribute American wealth abroad


We have among the most abundant energy reserves in the planet, sufficient to lift millions of America's poorest workers out of poverty. Yet under this agreement, we are effectively putting these reserves under lock and key, taking away the great wealth of our nation, great wealth, phenomenal wealth. Not so long ago we had no idea we had such wealth. And leaving millions and millions of families trapped in poverty and joblessness. The agreement is a massive redistribution of United States wealth to other countries. ... 

Beyond the severe energy restrictions inflicted by the Paris accord, it includes yet another scheme to redistribute wealth out of the United States through the so-called "green climate fund" -- nice name -- which calls for developed countries to send $100 billion to developing countries all on top of America's existing and massive foreign aid payments.

Sunday, May 7, 2017

Grand Rapids, Michigan, climate update for April 2017

Mean average temperature was 51.9 degrees F in April 2017 in Grand Rapids, Michigan. The mean for April back to 1896 is 46.5.

The lowest minimum temperature was 27. The mean for April is 22.

The highest maximum temperature was 81. The mean for April is 79.

Precipitation was 6.27 inches. The mean for April is 3.3. Sixth wettest April on record.

April snowfall was 0.4 inches. The mean for April is 2.3.

Heating degree days came to 391. The mean for April is 553. The total through April from July 2016 comes to 5366 vs. mean to date of 6404.

The heating season to date has been about 16% warmer than normal.