Showing posts with label TCMDO. Show all posts

Tuesday, October 11, 2022

Debt draws forward prosperity -- Ambrose Evans Pritchard


Payback is a bitch, or why everything sucks

Debt stopped buying economic growth, if it ever did in the first place, way back in 1982, but no one has seemed to notice.

Prosperity based on debt is not prosperity.

Debt draws forward prosperity, and then when you get forward, there's no prosperity there because you already made off with it.

It's like the polar explorer who starved and froze to death because he ate the food caches on the way to the pole instead of saving them for on the way back.


Friday, July 29, 2022

America and its people have added over $12 trillion to their total credit market debt outstanding just since 2019, but that has done little but stall the decline of debt growth

The $90 trillion millstone: We did it to ourselves.

We are now in the future we tapped in the past for the prosperity of "debt draws forward prosperity", and there's little here to be found.

From 1946 to 2008 when we hit the debt growth iceberg, real GDP grew at a compound annual rate of 3.324%. Since then it has fallen 49%, to 1.68%.

We should have stayed with capitalism in the post-war, where one risks actual savings instead of future notional tax, income, and fiat money "revenues". But capitalism went out the window a long time ago, bringing with it the end of the gold standard, the creation of the Fed, and the introduction of the income tax, among other horribles.

Payback is a bitch, and what can't be paid back won't. The rest comes out of your hide.


Sunday, July 11, 2021

In 2020 global debt to global GDP soared to 356%

Global debt finished 4Q at $281 trillion:  3.56x = $281 trillion, so x = $78.93 trillion global GDP.

US GDP in 2020 was $20.9 trillion, TCMDO was $83.49 trillion (almost 400%).

What could go wrong, right? You are fully invested in stonks, amirite?!

The problem is that the global corporate sector has been caught in the COVID-19 shock with unprecedented levels of financial leverage; global debt on non-financial corporations was $71 trillion at the end of 2018, representing 93% of global GDP.


Thursday, December 11, 2014

TCMDO expands at $1.27 Trillion annually 2007-2014 vs. $3.21 Trillion annually 2000-2007

The pace of debt creation has contracted by over 60% in the most recent seven year period as housing and banking hit the brick wall.

Sunday, September 7, 2014

Richard Duncan gets creditism wrong three ways

Richard Duncan gets creditism wrong three ways here for The Daily Reckoning last July in "Creditism and the Threat of a New Depression".

The most egregious error occurs right in the opening paragraph:

"Once we broke the link between dollars and gold, all the constraints on how much credit could be created were removed."

This is simply untrue, for two reasons.

One: Total credit market debt outstanding (TCMDO) has been doubling like clockwork in the post-war every six to eleven years, both prior to 1971 and after. The doubling of TCMDO occurred at its fastest pace -- two episodes of six year doubling times -- under Jimmy Carter and Ronald Reagan, five years after the close of the gold window in 1971. Otherwise the doubling has never taken as much as twelve years, whether before 1971 or after.

And two: 1971 is irrelevant. It was not the end of the gold standard. The gold standard ended under Roosevelt. In fact, the close of the gold window under Nixon was the first patriotic act with respect to gold by an American president since Roosevelt. With the stroke of a pen, Nixon single-handedly stanched the outflow of America's gold reserves, which had dwindled under Democrat and Republican presidents alike from 20 tonnes to 8,134 tonnes.

Secondly, because Duncan doesn't understand just how often TCMDO has been doubling in the post-war, he completely misses its needed and now missing rate of growth, and the accompanying fact that under normal circumstances of creditism in the United States, TCMDO ought to be at least $81 trillion by now instead of $59 trillion:

'But at this point, the question is will credit ever begin to grow again enough to drive the economy? We now have such a large base, 59 trillion dollars. If we assume that the inflation rate is two percent, then we need total credit to grow by four percent so that total credit, adjusted for inflation, will hit this “two percent recession threshold”.'

The last time TCMDO doubled in the post-war was in 2007, at $50 trillion. At the slowest pace of its actual growth in the post-war, it should hit $100 trillion by 2018. We aren't going to make it. It is shocking that a former head of equity research for Salomon Brothers is so completely unfamiliar with the Rule of 72. When something doubles in six years, the implied annual rate is between 11% and 12%. When something doubles in eleven years, the implied annual rate is 6%. 4% isn't going to cut it, buddy, and the current rate between 1% and 2% is truly catastrophic by all historical norms.

Thirdly, because Duncan hasn't properly imagined our past, the future also eludes him:

"If you look at all the big sectors of the economy, there are just a few of them. You can see that none of them are going to expand their debt enough to make total credit grow by two percent."

That's right in its way. There is no sector currently capable of driving credit expansion as it did in the past. And the reason is because it was mostly housing in the past which drove the borrowing, and housing is effectively dead for such purposes now because of the way greedy Baby Boomers, whether as homeowners or bankers, fiddled with it to plunder the equity stored there or drive securitization. The effect has been to gut the basis of Americans' wealth and poison the balance sheets of the banking system.

The way out of this mess is so filled with trouble that it is little wonder neither John McCain, Mitt Romney, Hillary Clinton nor Barack Obama have made fixing it a priority. It is the glaring need of our time, a Goliath with no fear of a David anywhere. It is why the economic meltdown remains the leading story of our time. It is why our other over-commitments will be our undoing. Until we settle it upon a firmer foundation as was done in the 1930s, or find a different, surer basis for economic growth, many decades of economic shrinkage await, not just one or two:

"If this collapses now, we’re going to have an equally protracted crash, and it’s not going to be a matter of taking a pain for a couple of years. The consequences of it would, I think, be a replay of the 1930′s and the 1940′s, but this time with nuclear weapons involved."


Thursday, September 4, 2014

PIMCO's Bill Gross wakes up to the wall hit by TCMDO, but not fully

Others saw this in April 2013.

Here's Bill Gross in September 2014:

The current outstanding total [credit] approximates $58 trillion and has been expanding at an average annual rate of 2% for the past five years, and 3.5% for the most recent 12 months. Put simply, if credit needs to expand at 4.5% per year, then the private and public sectors in combination must create approximately $2.5 trillion of additional debt per year to pay for outstanding interest. They are underachieving that target in the U.S., which is the reason why GDP growth struggles at 2% real or lower and nominal GDP growth seems capped at 4.5% or lower. Credit creation is essential for economic growth in a finance-based economy such as ours. Without it, growth stagnates or withers.

-------------------------------------

What Bill Gross doesn't seem to appreciate is the gravity of this slowdown historically to total credit expansion of just $1.14 trillion annually. TCMDO, total credit market debt outstanding, in the post-war DOUBLED every 6 to 11 years until 2007. That implies that normal credit expansion until 2007 was between 6% and 11% PER ANNUM. At 8.5%, an average level, TCMDO should grow well in excess of $4 trillion annually at these levels. 4.5% isn't going to cut it. And the actual 2% or even 3.5% is a catastrophe compared with the historical record.

By 2013, according to historical norms, TCMDO could have already reached $100 trillion if it matched the fastest pace on record under Jimmy Carter and Ronald Reagan. Instead it's stuck at $58 trillion in 2014.

The system has hit the wall. Decades of economic shrinkage, to borrow Chris Whalen's phrase, lie ahead, and we're already in the first one.

Incidentally, nonfinancial corporate debt has grown on average $567 billion annually between 2010 and 2014, accounting for about 50% of the average increase in TCMDO. And in 2013, corporations bought back something like $600 billion worth of their own stock. 


Friday, June 6, 2014

Monetarism on the rocks: TCMDO has grown less than 19% in 6.5 years

Deflation in today's economy is not a decline in the general price level but a decline in the expansion of total credit market debt outstanding, now unhelpfully called "all sectors credit market instruments liability level". The monetarists keep trying to get the borrowing engine going again, but to no avail, and the bottle of Viagra seems to be always in need of a refill. In six and a half years total credit market debt outstanding has grown by a paltry 18.7%. During the good old days of Jimmy Carter and Ronald Reagan TCMDO twice doubled in as little time. At this rate it will take 35 years from 2007 for TCMDO to double again when the longest it has taken in the post-war is about eleven and a half.

Conservatives may well mock the flacid, shriveling manhood of our metrosexual economy, but in the absence of structural measures designed to reward savers in the form of strong currencies and honest rates of return and punish spendthrifts with budget disciplines, what we are witnessing is a crack-up of epochal proportions which threatens to wipe away the achievements of centuries.

Who could possibly be happy about that?

The best that we can hope for is an arrangement which will buy us time to pay back what we have borrowed from the future for the prosperity of the past. It will require us to sober up. It will require personal repentance. The alternatives are a long slow decline into poverty, bankruptcy and war if we do nothing, or a stimulation-induced heart attack if we keep on the present path. 

Wednesday, May 28, 2014

Brian Wesbury sounds just like the regime: Dude, that bad GDP report was so two months ago

Brian Wesbury, here:

But regardless of which part of the GDP report accounts for the downward revision, the most important thing to remember is that the report is for the first quarter, the last days of which ended almost two months ago. It's a "rearview mirror" picture of the economy. The winter weather was awful, everyone knows it, and everyone knows that the economy in Q1 was weaker than in recent years.


---------------------------

Like Obama administration narratives which have consistently blamed exogenous events for bad economic news everytime it comes out, which has been every time (it is a global economy after all), facts must never be allowed to interfere with the reality, which in Wesbury's case is his narrative of the ploughhorse economy of continued growth of a plodding, unspectacular but nevertheless good-enough sort that we should all embrace as indicative of the resilience of the great free-market economy of the United States.

Ya man, hallelujah.

Nevermind growth has been declining since 1984 and precipitously since 2004 as America made the shift to wanton free trade and debt-fueled economic growth. TCMDO doubled at its fastest pace in the post-war under Carter/Reagan from 1977 to 1983 and under Reagan from 1983 to 1989, building the foundation of our present discontents in the form of massive debt.

When those bad actors pulled prosperity from the future into their present, our past, they neglected to tell us that we have to pay it back when we get to the future they pulled it from, our future, our now.

Welcome to it. Time to pay up, ploughhorses.

Saturday, December 28, 2013

Total Credit Market Debt Owed Has Grown Just 16% In 6 Years, The Smallest Increase On Record

Between July 2007 and July 2013, total credit market debt owed (TCMDO) has grown just 16%, by barely $8 trillion. It's the smallest increase on record for any six year period going back to when the data series begins in October 1949.

Going back six years from 2013 is instructive because the summer of 2007 was when the level of TCMDO last doubled (going back to the summer of 1999), and if you go back to the beginning of the data series you find doubling times of as few as 6 years in length to as many as almost 12. In other words, in a period of rapid credit expansion TCMDO might have conceivably doubled in our last six year period, but it hasn't. We sure could have used it. Instead it has for all intents and purposes collapsed, growing just $8 trillion from $50.032 trillion in 2007 to $58.082 trillion now.

From humble beginnings in 1949 when TCMDO stood at $400 billion, the level went on to double in the summers of 1961, 1970, 1977, 1983, 1989, 1999 and 2007. In order to double again (to a level of $102 trillion) by, say, 2019 (12 years from 2007), we're going to have to pick up the pace just a little . . .. Unless, of course, this debt-based economy has reached the limits of what it can do, which may be what the last six years is trying to tell us. 

Here's the data for TCMDO for the six year periods going back to July 1953:

7/1/13 $58.1 trillion (up  16%)
7/1/07 $50.0 trillion (up  74%)
7/1/01 $28.8 trillion (up  58%)
7/1/95 $18.3 trillion (up  45%)
7/1/89 $12.6 trillion (up 102%)
7/1/83 $06.3 trillion (up  97%)
7/1/77 $03.2 trillion (up  87%)
7/1/71 $01.7 trillion (up  57%)
7/1/65 $01.1 trillion (up  49%)
7/1/59 $00.7 trillion (up  42%)
7/1/53 $00.5 trillion.

As Ambrose Evans-Pritchard formulated it in 2011, "debt draws forward prosperity". In other words, we've already enjoyed the prosperity years ago which should be present today by literally pulling it back there from here, and now that we're here, well, there's nothing here, except for a measly 0.97% real average GDP report for the six years 2007-2012.

Time to pay.

Saturday, October 12, 2013

CNBC Exaggerates That The Debt Party Is Back On

Debt is expanding year over year at a rate 33% faster than compared to the previous period, but even so, CNBC's Jeff Cox here is exaggerating the significance:


"Whether it's corporate loans, all quality levels of bonds or simple consumer credit, the debt party is back on in the U.S., whether it's in the boardroom or the living room."


Debt expansion between April 2012 and April 2013 is up at a rate of only 3.5% compared to the period a year earlier when total credit market debt outstanding (TCMDO) expanded at a 2.6% rate.

TCMDO increased from $55.592 trillion in April 2012 to $57.563 trillion in April 2013, the latest date for which figures are available. In April 2011, TCMDO stood at $54.150 trillion.

As welcome as the present higher rate of debt expansion might be from a monetarist perspective, it's still a far cry from the historic post-war pattern which has witnessed TCMDO double every 6-11 years, with an average doubling time of 8 years.

A doubling time of 11 years implies an annual rate of debt expansion of about 6.5%, not quite double the actual rate in the last year. At the present rate, it will take TCMDO 20 years to double, an unprecedented slowdown in the pattern since the end of World War II.

The United States remains severely hampered when it comes to its traditional post-war debt-based economy.

Thursday, September 26, 2013

Total Credit Market Debt Has Grown Less Than 9% In The Last Three Years

The debt deflationary depression continues.

Total credit market debt owed (TCMDO), now unhelpfully renamed by the Federal Reserve "All Sectors; Credit Market Instruments; Liability" and perfectly Orwellian in doing away with both information-rich terms "debt" and "owed", has grown 8.76% from the recent April 2010 low to April 2013, about $4.64 trillion.

To put that in context, there have been episodes going back to 1949 when this measure has exploded 50% in three years' time so that doubling times for TCMDO have been as short as 6 years. The longest periods between doubling have been around 11 years long, and since 1949 have averaged about 8 years. The last time the metric doubled was in July 2007, at just under $50 trillion. At almost six years out from that date, we could well have been close to witnessing the number double again to $100 trillion by now based on past experience, or certainly something like half the way there, say to $70-$75 trillion. But here we are instead, at less than $57.6 trillion. It's like we hit a brick wall, the brick wall of a repossessed house most likely.

Say what you will against such a debt-based economy, its fundamental immorality, unsustainability and limits, but that's the economy we have, where the real money in the post-war has been in growth in borrowing, not in the money supply. From this perspective we have entered a long debt-deflationary depression, to get out of which borrowing will have to pick up to at least the point where TCMDO doubles at the extreme of the post-war experience, say by 2018, 11 years on from 2007.

Unfortunately for us, if the last three years are indicative of the new normal pattern of very slow debt expansion, it will take until about the year 2042 for TCMDO to double again to $100 trillion, another 29 years, an unprecedented slowdown in the American way of life.

This is what Chris Whalen meant when he warned in 2010 of decades of economic shrinkage ahead.

Thursday, May 9, 2013

Net Credit Market Debt Contraction In Two Sectors Is Repressing GDP

The domestic financial sector continues net negative in credit market debt outstanding, $3.27 trillion below the October 1, 2008 peak, as of October 2012.


And the household mortgage sector continues net negative in credit market debt outstanding, $1.22 trillion below the January 1, 2008 peak, as of October 2012.


These broken sectors for credit expansion have been large, important channels through which trillions in "money" has historically been created in the economy but no longer is, destroying GDP growth in the process. Until these channels are repaired, or replaced, total credit market debt outstanding will not double every 6-11.5 years as it has since the Second World War, and GDP will not recover to its historic 20th century levels.

TCMDO last doubled between 1999-2007
The level at which total credit market debt owed last doubled starting from 1949 was $49.8 trillion in July 2007. Five years later, in July 2012, the level was only $55.7 trillion when arguably it should have been already $74 trillion.

Something has gone horribly wrong with credit expansion in the United States, and the financial and housing sectors remain ground zero for the problem.

Thursday, April 18, 2013

Forget The "Threat" Of Deflation. Its Crushing REALITY Means Monetarism Is Doomed.

Galactic hitchhikers know this is the answer to everything.
Ambrose Evans-Pritchard and Lars Christensen, here, think deflation is only an omnipresent threat:

The world is still in a contained depression. Sliding commodities tell us global money is if anything too tight. "There is a threat of deflation almost everywhere. A lot of central banks will have to follow the Bank of Japan, whatever they say now," said Lars Christensen from Danske Bank.

The era of money printing is young yet. Gold will have its day again.


I couldn't agree less. The threat isn't everywhere. The reality is everywhere.


Total credit market debt outstanding (TCMDO) for the five years ended on July 1, 2012 was up a paltry $5.83 trillion. Yes, I said paltry. For monetarism to continue working as it has in the past, TCMDO needs to double on average every 8.25 years. That's the historical experience of America going back to the beginning of the post-war. At the current rate since 2007, however, it's going to take until the year 2049 for TCMDO to double from July 1, 2007.

We've had periods of doubling as short as six years for TCMDO, and periods as long as 11.5 years, but at the current rate over the last five years continued into the indefinite future it's going to take 42 years to double. 42 years. Not 11.5 years. And not 6 years. 42 YEARS. America has hit a brick wall.

People who talk about an L-shaped recovery and decades of economic shrinkage ahead may not appreciate quite adequately enough just how right they are.


Tuesday, April 2, 2013

Total Credit Money Creation Has Stalled Since 2007

Total credit money creation, aka total credit market debt outstanding (TCMDO), has stalled since 2007.

Doubling time for TCMDO has averaged 8.25 years between 1949 and 2007. The longest doubling times were 11.5 years from 1949 to 1961 and 10 years from 1989 to 1999. The shortest two episodes were each six years long: from 1977 to 1983, and from 1983 to 1989.

Real GDP over the longest periods increased 56% and 36% respectively. Over the shortest periods it increased 14% and 28% respectively.

Since 2007 TCMDO is expanding at a crawl, comparatively speaking, up at just 12% for the five years ended in July 2012. Real GDP for the period is a pathetic 3%.

At the current snail's pace, $1165 billion per year for the last five years, it will take until the year 2050 for TCMDO to double again.

Current quantitative easing programs continued indefinitely at the current rate of $1020 billion per year are as unlikely as previous iterations to lead to the expansion of TCMDO. The transfer mechanism is broken because the credit money creators, the banks, now prefer the option of investing elsewhere, which they did not have before 1999. The only way to fix that is to overturn Gramm-Leach-Bliley, and to reform mortgage lending. 

Credit money, the lifeblood of the nation, is not even reaching the veins, let alone flowing through them at a rate sufficient to generate any GDP heat.

Monday, April 1, 2013

Ben Bernanke Is Trying But Failing Miserably At Money Printing

And it's not exactly his fault.

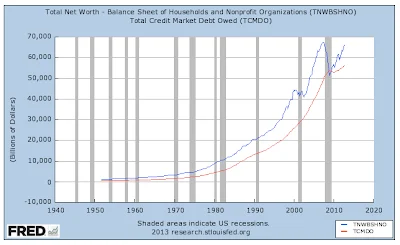
Historically in the postwar period, the increase in Total Credit Market Debt Outstanding (TCMDO) has closely shadowed the increase in Total Net Worth, seemingly helping to finance it, until the late great recession when for the first time, and very briefly, net worth flagged below the level of the debt owed. (Ignoramuses in the Doomosphere everywhere cried "Insolvency" at the time, not understanding the meaning of the term "net"). Ex post facto, net worth has made a dramatic upswing while the debt owed has increased at a much reduced rate by historical standards. To quote a famous president, "That doesn't make any sense."

Despite all the debt naysayers out there, total credit market debt is not increasing at anything like it should be, and appears to be disconnected to a significant degree from the recent increase in total net worth, which is up 29% since its nadir at the beginning of 2009, or $14.7 trillion. For the whole five year period from July 2007 (the last time TCMDO doubled, going back to 1999) to July 2012, TCMDO increased at a rate of just 12% and real GDP increased just 2.9%, whereas TCMDO increased at a rate of 100% between 1949 and 2007 on average every 8.25 years. The shortest doubling times have included two periods of 6 years each, one of 6.75 years, one of 8 years, one of 9.5 years, one of 10 years, and one of 11.5 years. The very worst real GDP performance of all of those was for a 6 year doubling period when we got 14% real GDP, nearly 5 times better than we're getting now. All the rest posted real GDP of between 23% and 56%.

It is evident that Ben Bernanke's quantitative easing program (right scale) anticipated the leveling off of TCMDO (left scale). Clearly he expected the troubled banks to need a push to keep the credit money creation process going, but didn't understand how fruitless it would be. One notes that he has added about $2 trillion to the monetary base from the middle of the late great recession. By contrast, TCMDO is up (only!) $9 trillion from the beginning of 2007. By historical standards TCMDO should be up $25 trillion by now if TCMDO is to double again in ten years from 2007. And it should be up a lot more than even $25 trillion by now if it's to double sooner than ten years. At the average doubling time of 8.25 years, the $49.8 trillion of TCMDO in July 2007 should hit $99.684 trillion by October of 2015 if the postwar pattern is to continue. Instead, at the current rate of growth in TCMDO, it's going to take an unprecedented 27 years to double it, unless of course there are limits to borrowing to fuel growth, as many are beginning to tell us. In either event one can only assume there will be only pathetic real GDP growth going forward, if there is any at all.

Clearly something is horribly amiss in the transmission process of credit money creation for the first time in the postwar. Seemingly gargantuan quantities of money from the Fed through the process of quantitative easing should be seeding the banks who in turn should be creating massive amounts of credit way beyond the $9 trillion so far created. Instead, the banks are doing something else with it, by-passing the normal distribution channel. Some of the seed money is being held back to comply with increased capital requirements, to be sure, but more appears to be going directly into household net worth creation through investment gains from the stock market, enriching a very few bondholders, shareholders and banking industry players through the private trading desks of the banks, a unique development by historical standards made possible only since 1999 with the abolition of Glass-Steagall through the Gramm-Leach-Bliley Act. As an act of Congress, Ben Bernanke can't do much about that even if he is the most powerful man in the country.

In the absence of a creative policy change from the Fed whereby Congressional intent would be thwarted and money would actually reach the marketplace through a different avenue than the uncooperative banks, one must conclude that the Fed thinks it necessary to continue the various easing schemes because it judges the banks to be still too fragile to risk stopping them. That would be putting the best construction on the matter, to borrow a phrase from Luther's catechism. Either that, or the Fed itself has been completely captured by the bankers.

Wednesday, January 23, 2013

Money Available For Spending Is Up Over 70% Since 2008, But Total Debt Is Up 7%

M1 money supply has gone up about $1 trillion between mid-2008 and now, almost 5 years. This is basically spending money which is not being spent.

Total credit market debt fell an equivalent amount, but all of it in 2009, so one cannot say the one "offset" the other. (The extra M1 was saved over the nearly five year period. The debt was discharged somehow, through pay-downs or defaults, and relatively quickly during the year of the biggest GDP decline in post-war memory). And since early 2010, total debt is back up over $2.5 trillion. And since 2008 TCMDO is up over $3.6 trillion overall.

Somebody is ramping up debt just like before the crisis, but it's not the consumer.

Saturday, June 23, 2012

Growth of Borrowing Has Far Outpaced Growth in the Economy

As seen here:


The debt of government at all levels plus the debt of corporations and households is now $54 trillion and counting.

GDP lags far behind, which explains the reason for the Fed's war on interest rates: to keep the cost of all this borrowing spending as low as possible.