Showing posts with label Climate 2016. Show all posts

Sunday, December 4, 2016

November 2016 climate summary for Grand Rapids, Michigan

November 2016 climate summary for Grand Rapids, Michigan


Average temperature was 45.4 degrees F. Normal is 39.1. The month ranked 4th warmest November since 1892. The YTD average temperature was 53.4, the 4th warmest YTD average among the previous four warmest full years on record. The normal YTD average temperature is 50. The YTD average temperature in the hottest full year on record in 2012 was 54.4, in 1921 was 54.2, in 1931 was 53.7, in 2016 was 53.4 and in 1998 was 53.2 (the last three were all El Nino episodes).

The lowest temperature recorded this November was 21. The normal lowest temperature is 17. The highest temperature this November was 73. The normal highest temperature is 66.

November 2016 saw 3.24 inches of precipitation. Normal is 2.84. YTD precipitation is 43.33 inches, normal YTD is 31.94. The wettest full year on record was 2008 with 48.80 inches. The driest full year was 1930 with just 20.92.

Snowfall measured 0.8 inches. Normal for November is 6.4 inches. The seasonal total is 0.8 inches, and the normal seasonal total is 6.8. Normal seasonal snowfall is 66.7 inches. The snowiest season on record was in 1951-52 with 132 inches of snow. 1905-06 was the least snowy with 20.

There was no change to Cooling Degree Days in November. YTD there were 936 CDD, the 15th warmest on record so far. Normal CDD is 694.

Heating Degree Days totaled 44 in September, 324 in October and 580 in November for a total of 948 for the season so far. Normal HDD seasonally is as follows: July, 9, August, 19, September, 137, October, 427 and November, 770 for a seasonal normal to date of 1362. Normal for a full season is 6713 HDD. The coldest winter season by HDD was in 1903-04 with 7712. The warmest was in 2011-12 with just 5253.

Actual lower HDD presently have been indicative of the after effects of warmer conditions prevailing since the end of the El Nino this summer. The Very Strong El Nino of 2015-16, averaging 1.43 on the index and 15 months long, was longer but weaker than the 1997-98 episode, which averaged 1.56 on the index and was 13 months long. The 1982-83 VSE averaged 1.3 on the index and was 15 months long.

The Oceanic Nino Index value for the August-September-October measuring period was -0.7, the second consecutive measurement at -0.5 or lower. Five such values consecutively would indicate the onset of a La Nina, which could produce wetter conditions in the US High Plains and Upper Midwest and lots of snow in Canada.

No thanks. Been pretty wet in these parts already, Pilgrim.


Saturday, November 19, 2016

I got your climate change right here in Grand Rapids, fella

Yesterday at 1453 hours we hit the high for the day at 70 degrees F.

Today at 1453 hours it was 33, less than half that.

And we had our first snow of the season, high winds and an 18-hr power outage.


Tuesday, November 8, 2016

October 2016 climate summary for Grand Rapids, Michigan: 17th warmest on record and 8th wettest

October 2016 climate summary for Grand Rapids, Michigan


Average temperature was 54.7 degrees F. Normal is 51.3. The month ranked 17th warmest October since 1892.

The YTD average temperature was 54.2. The normal YTD average temperature is 51.1. The YTD average temperature in the hottest full year on record in 2012 was 55.8.

The lowest temperature in October was 33. The normal lowest temperature is 28. The highest temperature in October was 79, which is also the normal highest.

October 2016 was the 8th wettest on record with 6.15 inches of precipitation. Normal is 2.92 inches. YTD precipitation is 40.09 inches, normal 29.23.

There were 10 Cooling Degree Days in October. Normal is 8. YTD there were 936 CDD, the 15th warmest on record so far. Normal CDD is 694.

Heating Degree Days totaled 44 in September and 324 in October, for a total of 368 for the season so far. Normal HDD seasonally is as follows: July, 6, August, 14, September, 132 and October, 440 for a seasonal normal to date of 592.

Actual lower HDD were indicative of the warmer conditions prevailing after the end of the El Nino this summer. The Very Strong El Nino of 2015-16, averaging 1.43 on the index and 15 months long, was longer but weaker than the 1997-98 episode, which averaged 1.56 on the index and was 13 months long. The 1982-83 VSE averaged 1.3 on the index and was 15 months long.

Thursday, October 6, 2016

Contemptible WaPo says anti-intellectual parents endanger their own kids by withholding vaccines, ignores flood of disease pouring in with illegals

And we tried to stop the 911 terrorists from hitting Washington why? These assholes deliberately settle these illegal aliens not in DC but in the hinterlands of middle America, out of spite.


Americans have a long and ignoble tradition of denigrating expertise. Today, nearly 40 percent of adults think there isn’t evidence for global warming. Skeptical parents won't vaccinate their children, endangering their communities with breakouts of preventable diseases like measles. So maybe we can make a deal. If we want experts to listen to our opinions, we might also do them the courtesy of sometimes listening to their opinions, too.

Sunday, October 2, 2016

September 2016 climate summary for Grand Rapids, Michigan: 10th warmest since 1892 by average temperature

September 2016 climate summary for Grand Rapids, Michigan

Average temperature was 66.4 degrees F. Normal is 62.7. The month ranked 10th warmest September since 1892. The hottest September by average temperature was in 1931 at 69.0. September 2016 was 3.8% cooler than that.

The normal 9-month average temperature is 51.0. Year to date the average temperature is 54.1, about 6.1% warmer than normal due to the El Nino, which ended this summer. The warmest full year on record by average temperature was 2012, at 52.8. The 9-month year to date average temperature in 2012 was 56.4, about 4.25% warmer than in 2016.

Here is 2016 average temperature 9-months year to date in perspective:

1921: 56.44
2012: 56.40
2010: 54.55
1998: 54.47 (VS El Nino year)
1894: 54.36
1931: 54.18 (El Nino year)
2016: 54.11 (VS El Nino year).

September 2016 was drier than normal with 2.4 inches of rain. Normal is 3.57. Year to date 33.94 inches of rain have fallen. Normal year to date is 26.31. Still cuttin' grass.

Cooling degree days totaled 95 in September, 28% above the normal 74. The warmest September by CDD occurred also in 1931 with 185 CDD. September 2016 was 49% lower than that.

Year to date CDD totals 926, 35% higher than the normal 686 for the year to date. The record for highest annual CDD was set in 1921 at 1200, for lowest annual CDD in 1992 at 316. Normal annual CDD is 694. Year to date CDD is 33% above the normal annual level, but still 23% below the record annual level set in 1921.

Tuesday, September 20, 2016

The recently ended El Nino shifted the declining 21st Century temperature trend UP by over 75%, but it's still declining!

Before the El Nino:


After the El Nino (which was already over by the May-June-July measuring period):


Saturday, September 17, 2016

The five warmest years in Grand Rapids, Michigan by average annual temperature weren't the last five

The five warmest years to date in Grand Rapids, Michigan:

2012: 52.8 degrees F
1931: 52.2
1921: 52.2
1998: 51.5
2010: 51.1.

The mean is 48.2.

2016 through August has been running about 6% above the mean. If that continues through the final four months of the year, 2016 will finish the year near 51.1, tied with 2010.

Note that 2015-2016 and 1997-1998 were two of the three Very Strong El Nino episodes since 1950. 1930-1931 was also an El Nino.

Sunday, September 4, 2016

Grand Rapids, Michigan August 2016 climate summary: 11th warmest since 1892 by average temperature

Average temperature was 73.5 degrees F. Normal is 70.2. The month ranked 11th warmest since 1892. The hottest August by average temperature was in 1947 at 77.7. August 2016 was 5.4% cooler than that.

The normal 8-month average temperature is 49.6. Year to date the average temperature is 52.6, about 6% warmer than normal due to the El Nino, which ended with the April-May-June measuring period. The warmest full year on record by average temperature was 2012, at 52.8. The 8-month year to date average temperature in 2012 was 55.6, 5.7% warmer than the 2016 year to date. The May-June-July Oceanic Nino Index value has fallen to 0.2.

August 2016 was the second wettest on record with 7.97 inches of rain. Normal is 3.05. Year to date 31.54 inches of rain have fallen. Normal is 22.74. We're cutting grass.

Cooling degree days totaled 274 in August, 45% above the normal 189. By CDD August 2016 was tied for 13th warmest August on record. The warmest August by CDD occurred in 1947 with 404 CDD. August 2016 was 32% lower than that.

Year to date CDD totals 831, 36% higher than the normal 612 for the year to date. The record for highest annual CDD was set in 1921 at 1200, for lowest annual CDD in 1992 at 316. Normal annual CDD is 694. Year to date CDD is already almost 20% above the normal annual, with fewer than 100 CDD normally added in the remaining four months of the year. Air conditioning has been more than welcome this summer. 

Tuesday, August 30, 2016

Stupid, ignorant and blind liberal buys home in 100-year flood plain in Troy, NY, blames 100-year old 30-foot river wall (doh!), racism, capitalism, classism and climate change, not herself when she floods

I'm not making this up. She admits it.

Where else but in The Nation, here:

Troy floods. It has since before the Dutch arrived. I didn’t know this when I bought my house. I bought it because the chiming, rippling Poesten Kill canal runs through the backyard; because it has rusty old tin ceilings; and because I wanted to be a member of a vibrant, diverse urban neighborhood that comes together in summer evenings. ... When I realized that the property was in a floodplain, I hesitated and asked around. Friends, real-estate agents, and neighbors assuaged my fears: It’s a 100-year floodplain, they said—and look at the height of those canal embankments! You’ll be fine. ... We weren’t legally required to have flood insurance, and we couldn’t find enough money in the budget for it anyway. So we decided that we would take our chances. ... 

Sunday, August 21, 2016

Winter's coming . . .

. . . it's 65 degrees F right now in Grand Rapids, Michigan.

The winter, January through March, is forecast to be colder and snowier than normal.

Thursday, August 18, 2016

"Science": "Hottest July on record", but not in Seattle, Boulder, Madison, Chicago or Grand Rapids

Seattle's hottest Julys
Boulder's hottest Julys
Madison's hottest Julys
Grand Rapids' hottest Julys
Chicago's hottest Julys

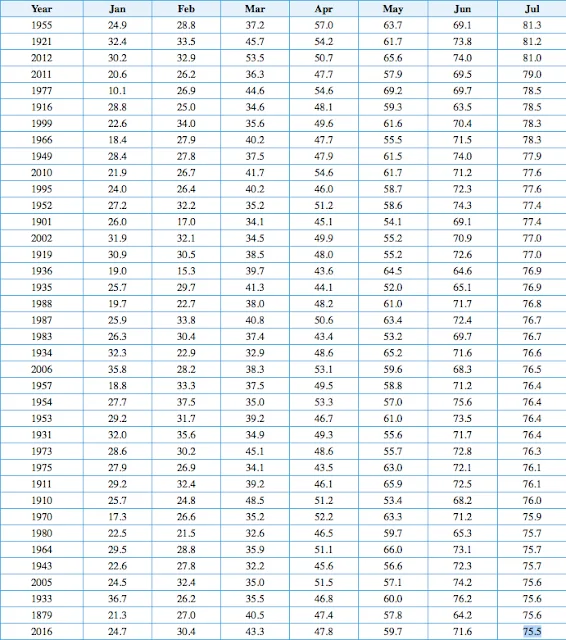
July 2016 hottest on record, they say, but not in Grand Rapids, MI: Average temperature ranked 21st since 1892

Warmest average July temperatures in Grand Rapids ranked

But 70% of the top ten hottest Julys in Grand Rapids, Michigan occurred before World War II.

Sunday, August 7, 2016

Seven months into 2016, the climate in Grand Rapids, MI, has been 6% warmer and 24% wetter than average, thanks to the now ended El Nino

Average temperature year to date: 49.58 degrees F.
Mean year to date: 46.62.
Departure from normal: +2.96, or +6.3%.

Average of maximum temperatures monthly year to date: 76.28 degrees F.
Mean year to date: 73.57.
Departure from normal: +2.71, or +3.7%.
July had 8 days 90+ degrees. June, 6 days.
Mean annual maximum temperature is 95.
Maximum temperature so far in 2016 is 93.

Average of minimum temperatures monthly year to date: 23.14 degrees F.
Mean year to date: 21.14.
Departure from normal: +2, or +9.5%.
There have been no days below zero so far in 2016.
Mean annual minimum temperature is -7.
Minimum temperature so far in 2016 is 1.

Cooling degree days year to date: 557.
Mean year to date: 423.
Departure from normal: +134, or +31.7%.

Heating degree days year to date (January -- June): 3762.
Mean year to date: 4226.
Departure from normal: -464, or -11%.

Snowfall year to date (January -- June): 55.1 inches.
Mean year to date: 43.3 inches.
Departure from normal: +11.8, or +27.3%.

Rainfall year to date: 23.57 inches.
Mean year to date: 19.69.
Departure from normal: +3.88, or +19.7%.

Saturday, August 6, 2016

Very strong El Nino ends with June 2016 as 3 month average through July falls to 0.2 on the index

The El Nino was 15 months long averaging 1.43 on the index, coming right in between the 1997-98 very strong El Nino which was 13 months long and averaged 1.56 on the index and the 1982-83 VSE which was 15 months long and averaged 1.33.

Thursday, July 21, 2016

How hot is it in Grand Rapids, Michigan so far in 2016?

Mean cooling degree days through July: 423.

Actual cooling degree days in 2016 through July 19: 432.

Sunday, July 10, 2016

The current very strong El Nino is now 15 months long, averaging 1.45 on the index, and looks about done

This El Nino looks about done, with the last running 3-month mean value coming to just 0.7 on the index. Anything below 0.5 next time will mean we are truly finished with it. 

Five months after peak, the fall-off has come to almost 70% of peak value, a little less impressive than the fall-off of over 78% similarly measured for the 1997-98 episode.

The 1997-98 very strong El Nino was 13 months long and averaged 1.56 on the index.

The 1982-83 VSE was 15 months long and averaged 1.33.

The weather will be a changin'.


Sunday, July 3, 2016

Grand Rapids, Michigan, has just logged its third warmest winter ever in terms of heating degree days in 2015-16

June 2016 is over and the data are in.

From 1892 Grand Rapids, Michigan, has just experienced its third warmest winter ever in terms of heating degree days for the winter measuring season ending in June. When we have fewer heating degree days here up north that means lower demand for heat during the typical eight month long period when heating is needed. 

Mean heating degree days for the season from the beginning of the record to date now average 6713, but in 2015-16 Grand Rapids logged just 5617, a whopping 1096 below the long term mean, about 16.3% fewer heating degree days than normal. In my case that translated into a natural gas consumption reduction of about 10% compared with most winters I have experienced.

The warmest winter on record was actually quite recent and unrelated to an El Nino as now. In 2011-12 just 5253 heating degree days were logged in Grand Rapids. Second place belongs to the long ago winter of 1920-21, with 5520 heating degree days.

At the same time that we experienced these warmer conditions snowfall for the season came in only 5.6 inches lower than the long term mean of 66.7, at 61.1 inches.

Last November I predicted much less snow at 47.85 inches and many more heating degree days at 6148, both representing averages of previous observations in Grand Rapids during Very Strong El Nino periods in 1982-83 and 1997-98. But we were this season much snowier and warmer than those averages predicted. 

Turning to the year to date categories, rainfall is actually running 1.41 inches above the mean to date of 16.54 inches, at 17.95. This is despite the extremely dry conditions in June which have left our lawns brown.

The cumulative average temperature year to date is running a total of 18.6 degrees F above the long term mean for the six months to date. That's about one tenth of a degree above normal per day to date.

The current Very Strong El Nino after fourteen months is averaging 1.5 monthly on the index. June data is not yet available. The most recent previous Very Strong El Nino averaged 1.56 monthly over thirteen months, in 1997-98.


Wednesday, June 8, 2016

Global cooling in Grand Rapids, Michigan, in my lifetime

Mean average temperature 1892-1956: 48.2 degrees F

Mean average temperature 1956-2015: 48.0 degrees F

Sunday, June 5, 2016

The current very strong El Nino now extends to 14 months, averaging 1.5 on the index

We now have three back to back periods of 1.9, 1.6 and 1.1 on the index, indicating the El Nino is winding down rapidly from its high point in November-December-January at 2.3.

Year over year, abnormally dry conditions and worse have been reduced by El Nino rains from 50.73% of the country at the end of May 2015 to 31.82% of the country now, an improvement of just over 37%. Central and southern California remains hard hit.


Grand Rapids, MI, reported temperature anomaly for May 2016 was +1.7 degrees F

Temperature averaged 60.4 degrees F, according to the preliminary monthly climate data for May 2016 in Grand Rapids, MI. The cumulative reported total anomaly year to date rises 1.7 from +7.3 last month to +9.0 degrees F in May. Using the full NOW data set going back to 1892, however, the cumulative temperature anomaly for the first five months of 2016 is +15.9 degrees F. 

Snowfall was only a trace in May, still totaling 61.1 inches to date, but now 4.9 inches below the long term mean average of 66 inches, with one month left in the measuring period.

Heating degree days (HDD) in May at 206 were 18.25% below the long term normal for the month. The long term mean expected HDD to date would be 6663. Actual HDD to date were 5596, 16% below normal, thanks to the El Nino, with one month left in the measuring period.

It is notable that neither this El Nino nor any other since 1950 has come close to producing the warm winter Grand Rapids experienced in 2011-2012 when the heating degree day measurement hit an all time record low of 5253. Placeholders two and three for warmest winters by HDD after 2011-12 were 1920-21 at 5520 and 1931-32 at 5619. 2015-2016 looks set to join the list, however, of the top five warmest winters by HDD.