Tuesday, September 15, 2020

Given urban heat island distortions of +1 to +7 degrees F, average temperature rise of less than 0.3 degrees F above the mean since 1898 in Grand Rapids, MI is suspect

Given urban heat island distortions of +1 to +7 degrees F, average temperature rise of less than 0.3 degrees F above the mean since 1898 in Grand Rapids, MI is suspect (image D).

US EPA Heat Islands page:

"A review of research studies and data found that in the United States, the heat island effect results in daytime temperatures in urban areas about 1–7°F higher than temperatures in outlying areas and nighttime temperatures about 2–5°F higher. Humid regions (primarily in the eastern United States) and cities with larger and denser populations experience the greatest temperature differences. Research predicts that the heat island effect will strengthen in the future as the structure, spatial extent, and population density of urban areas change and grow".

The US Historical Climatology Network station in Grand Rapids, Michigan, looks increasingly compromised by urban heat island effects. It is located at the Gerald R. Ford International Airport (image A), where the main 8,500 foot runway did not become operational until 2001 and where 2 million passengers were not served for the first time until 2004.  

The weather station is located in the northwest corner of the 3,000 plus acre airport grounds at 4899 Tim Dougherty Dr, Grand Rapids, MI 49512 (image B). One can see it is now surrounded by industrial development to the north and west, the airport to the south and east, and a busy county road commission facility right east of the measurement station, which is accessed by a little walkway leading from the National Weather Service building (image C).

The county population has doubled in the last sixty years.

One can observe from the history of maximum temperature at the station (image E) that the trend is clearly lower by nearly 1.5 degrees F from the mean maximum over the whole period. The trend for minimum temperature is even lower, by over 2.0 degrees F from the mean (image F).

Click any image to enlarge.

A

B


C


D
E
F

Sunday, September 13, 2020

The Sweden apologists are still ridiculous: Sweden deaths per million of population might as well be Mexico

Hey, let's hear it for Moldova, huh?

The cop we most need right now


US COVID-19 deaths update through 9/12/20

COVID-19 deaths per day in the entire USA, monthly through 9/12/20:

Mar    138
Apr  1,961
May 1,330
Jun     769
Jul      851
Aug    955
Sep    839 (12 days).

Assuming the current September rate per day through the end of September will mean ~208.6k dead by October 1. Assuming it through the end of the year puts us at ~285k dead by the end of the year.

Consider California as a proxy for the death distribution: 7% of deaths there are aged 0-49, 93% are aged 50+. 19% of deaths are aged 50-64, 74% are 65 or older.

In the 25 worst states for average daily new deaths since the beginning of the pandemic, the week ended 9/12 witnessed 877/day, which is a new low since I began tracking this on July 11, two months ago:

7/11 917
7/18 907
7/25 899
8/1   906
8/8   905
8/15 906
8/22 905
8/29 899
9/5   890
9/12 877.

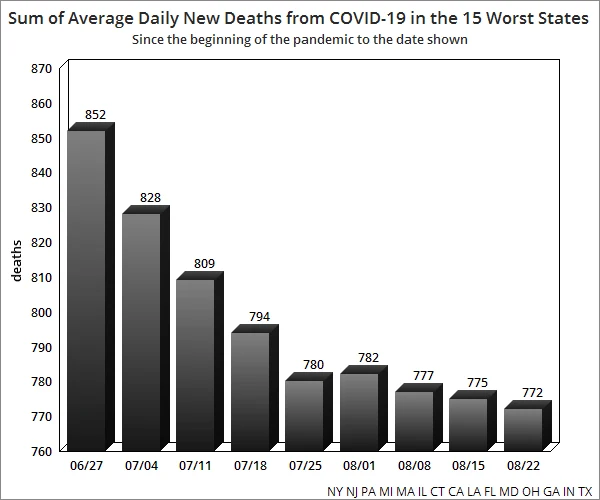
In the 15 worst states for deaths measured this way, identified in June, the daily average is down 66 over the last two months. In the 10 second tier states for deaths, however, the average is up 26 per day.

One state which has not been in either list is Tennessee, which epitomizes the above noted change in the course of the pandemic. Tennessee started to become a data problem in August, competing with second tier states Missouri and Washington with nine average daily new deaths per day since the beginning of the pandemic.

Now Tennessee is up to eleven as of 9/12/20 whereas Missouri has been flat at nine since the beginning of July and Washington ticked up from eight to nine at the end of July and has been flat ever since. Here's the monthly COVID-19 deaths per day in Tennessee, which shows how August really piled up the numbers there:

Mar 0.41
Apr 6.23
May 5.16
Jun 7.90
Jul 14.51
Aug 21.93
Sep 26.08 (12 days).

Lest we get lost in the weeds, however, the overall picture for the US remains positive with a fourth consecutive week of decline in the compound daily growth rate of deaths measured weekly. It would be best if the deaths just stopped, but at least the growth rate continues to come down . . . for now.


Thursday, September 10, 2020

Wednesday, September 9, 2020

It's been a bumper crop of stupid lately from the PhDs, from Boston University to Hillsdale College

Ibram Kendi of Boston University for The Atlantic completely slaughters the meaning of the traditional Latin motto of the United States, perhaps the most basic thing everyone used to remember from civics classes, and Ben Winegard of Hillsdale College doesn't have the foggiest idea that "contingency" is a philosophical concept derived from Aristotle by way of St. Thomas Aquinas (contingent being), and that Gould is actually arguing against egalitarianism.

You don't have to be Rush Limbaugh to be a big fat idiot these days.

Could be just about anybody, and too often is.

Beware dumbasses . . . everywhere.


Monday, September 7, 2020

I'll bet Kamala Harris loves sweet potato, too

"Sweet Potato Tastes Good. I Like It."

Climate update for KGRR August 2020

Climate update for KGRR August 2020

Max T 91, Mean 92
Min T 52, Mean 47 (tied for 5th warmest low on record with 2018, 2001 and 1938; 1900 and 1939 are tied for warmest minimum at 56)
Av T 72, Mean 70.3
Rain 2.6, Mean 3.07
CDD 228, Mean 189
Cooling Degree Days, season to date 793, Mean to date 615


Hillsdale College "conservative" repeating stupid about COVID


BREAKING: AIRLINER WITH 167 ABOARD CRASHES IN ATLANTIC, KILLING ONLY 10 . . .


THE OTHER 94% DIED OF HEART DISEASE, CANCER, DIABETES, OBESITY, DROWNING, AND SHARK ATTACK. -- The New York Postmortem

Sunday, September 6, 2020

Despite having below average growth rates for Covid deaths over the summer, New Jersey, New York, Illinois, Massachusetts and Pennsylvania all made the top ten list for deaths contributed


Top US states for COVID-19 deaths added Memorial Day weekend to Labor Day weekend:

TX 12,138
CA  9,940
FL  9,578
*NJ  4,904
AZ  4,408
GA 4,048
*NY 3,679
*IL  3,588
*MA 2,812
*PA 2,716
SC 2,452
*LA 2,352
OH 2,300
NC 2,150.

The compound daily growth rate for US COVID-19 deaths weekly has hit a new low

But don't be fooled.

Deaths per day measured on a monthly basis continues to rise after bottoming in June:

Mar    138
Apr  1,961
May 1,330
Jun     769
Jul      851
Aug    955
Sep    987 (5 days).

Total deaths added between Memorial Day weekend and Labor Day weekend from all states came to 91,350. That's equal to more than 94% of the deaths added until May 23.


Hard hit states NY and NJ from the beginning of the pandemic continue to feature prominently in the list of states adding the most deaths over the summer, if not in the headlines. While everyone was crowing about how bad Arizona was, New Jersey and New York were still in the top 10 contributing deaths, along with Illinois, Massachusetts and Pennsylvania. Georgia made headlines for political reasons (Republican governor) while California did not.

TX 12,138
CA  9,940
FL  9,578
NJ  4,904
AZ  4,408
GA 4,048
NY 3,679
IL  3,588
MA 2,812
PA 2,716
SC 2,452
LA 2,352
OH 2,300
NC 2,150.

We remain on track to post nearly 300k dead by the end of the year.


Friday, September 4, 2020

If summer death trends continue, expect 235,000 to 241,000 US COVID-19 deaths by the end of October 2020

COVID-19 deaths per day in the US averaged 769 in June, 851 in July, and 955 in August, per the New York Times data I track.

At the average of these, 858 per day, we'll be at 235,811 by the end of October, and 288,149 by the end of the year.

At the August rate we'll be at 241,728 by 10/31 and 299,983 by the end of the year.

Compound daily growth rates measured weekly over the three months show a decline, a rise, and a decline, producing these comparatively modest ascending results. Daily deaths in April averaged 1,961 and 1,330 in May.

Deaths from COVID-19 in the US in 2020 are already the third leading cause of death, ahead of unintentional injuries using 2017 data as a benchmark, and they will stay that way.

Top causes of 2,813,503 registered deaths in 2017: 

Heart disease 647,457
Cancer 599,108
Unintentional injuries 169,936
COPD, other lung diseases 160,201
Stroke, other brain vascular disorders 146,383...
Flu 55,672

More.


Monday, August 31, 2020

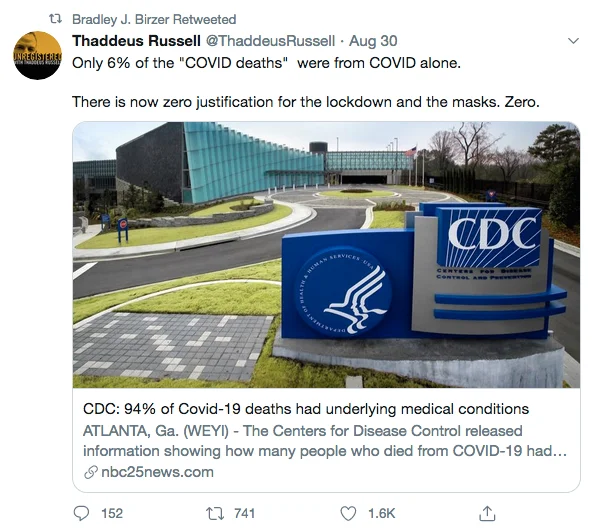
Hey Rush Limbaugh, you big fat idiot, cancer isn't the cause of death in the majority of lung cancer deaths! 94% died of contributing causes!

The autopsies from 100 patients who died of lung cancer between 1990 and February 2011 were analyzed.

Tumor burden was judged the immediate cause of death in 30 cases. ...

Infection was the immediate cause of death for 20 patients. ...

Complications of metastatic disease were the immediate causes of death in 18 cases ... 6 cases of hemopericardium from pericardial metastases, 3 from myocardial metastases, 3 from liver metastases, and 3 from brain metastases. 

Other immediate causes of death were pulmonary hemorrhage (12 cases),

pulmonary embolism (10 cases, 2 tumor emboli),

and pulmonary diffuse alveolar damage (7 cases).

From a functional (pathophysiologic) perspective, respiratory failure could be regarded as the immediate cause of death (or mechanism of death) in 38 cases, usually because of a combination of lung conditions, including emphysema, airway obstruction, pneumonia, hemorrhage, embolism, resection, and lung injury in addition to the tumor.

For 94 of the 100 patients, there were contributing causes of death, with an average of 2.5 contributing causes and up to 6 contributing causes of death.

The numerous and complex ways lung cancer kills patients pose a challenge for efforts to extend and improve their lives. Lung cancer kills in many ways.

Bronchial obstruction from lung cancer can cause pneumonia, making pneumonia the immediate cause of death.

Lung cancer can invade and disrupt blood vessels with resulting fatal hemorrhage.

The hypercoagulable state of malignancy from lung cancer can cause fatal pulmonary thromboembolism.

The burden of tumor in the lungs or the liver can cause these organs to fail, resulting in a patient's demise.

The tumor burden of extensive widespread metastases can essentially starve to death a patient with lung cancer.

These are only some of the mechanisms of death from lung cancer.

Although lung cancer is the leading cause of cancer death worldwide, including more than 150 000 deaths/y in the United States, little is published identifying or quantifying the causes of death for patients with lung cancer.


But there you go today, still America's biggest dummy, having learned absolutely nothing about your own, pathetic situation and what the CDC is trying to tell you:

... the CDC. “For 6% of the deaths COVID-19 was the only cause mentioned. For deaths with conditions or causes in addition to COVID-19 on average, there were 2.6 additional conditions or causes.” These are called morbidities. In other words, folks, for 94% of deaths, the virus was there but didn’t cause the deaths.

No Rush, just the opposite. You always manage somehow to get these things totally ass-backwards.

Most of the things which will kill you because of your lung cancer wouldn't kill you if not for your cancer, same as most of the things which kill COVID-19 victims wouldn't kill them, and more importantly don't kill them, if not for the virus.


Sunday, August 30, 2020

Growth of COVID-19 deaths in the US continues to slow, hospitalizations have plummeted almost 20k in a month

trend looks good for possible re-test of Jul 4 low
a new interim low of 763 was set on Wed Aug 26
WA & MO have been at 9 interminably, but TN just popped to 10 (not shown)
For hospitalization metrics shown Texas is in pink in the graphs, California in blue, Florida in green and Georgia in brown. Click image to expand. Those are the states with the largest number hospitalized as of today. All are coping just fine.

A month ago nearly 20k more were hospitalized nationwide for coronavirus than now.

I will have to make some different charts for deaths in the near future to capture the evolving picture.

Saturday, August 29, 2020

Michael Anton, Publius Decius Mus, is back, and it's still Flight 93

After “Is 2020 another ‘Flight 93 election?’” the question I most often hear is “What happens if Trump loses?”
  
The answer to the first question, unfortunately, is yes, but more so. 
 

Wednesday, August 26, 2020

The George Floyd hospital blood toxicology results entered in evidence yesterday are the biggest story of the summer, and Mark Levin isn't even interested tonight

Same old, same old Mark Levin, Mr. NeverTrump for most of 2016.

This dinosaur is so behind the curve on everything it's ridiculous, comic, entertainment!

Chief Hennepin County Medical Examiner: "Hospital Blood" from George Floyd as opposed to autopsy blood showed "fatal level of fentanyl" consistent with "overdose death"


They've known this shit since June 1 but it wasn't filed with the court until August 25.

These bastards in Minnesota inflamed the whole country over nothing.

Sunday, August 23, 2020

Hillsdale College, Rush Limbaugh's bastion of conservatism, employs an assistant professor of psychology who thinks human beings of no more significance than cicadas

If that's true, then we can exterminate human beings at will: Blacks, Muslims, Jews, Whites, Christians, Hindus, old people, infants, and our rotten, noisy neighbors. 

After which we can eat them, just like Rush Limbaugh's great Americans, the Donner Party. 

The coronavirus death trend overall shows continued improvement in the United States through 8/22

The compound daily growth rate of deaths for the whole country has dropped again in the last week, as has the sum of average daily new deaths in the 15 worst states since the beginning.

10 second tier states, however, continue to show an uptrend in deaths measured the same way.

Today's hospitalization snapshot shows things have really cooled off in the hardest hit states. Texas (pink), Florida (green), California (blue), Georgia (brown) and Illinois (purple) are shown in the charts for three metrics relative to New York (gray).

Arizona has dropped to 9th for hospitalization severity.  The Grand Canyon State is presently contributing an average of 23 daily new deaths since the beginning of the pandemic to the totals. On July 11 the average was just 13. 2,602 people have died there from coronavirus since then.


Based George Wallace

George received 13.5% of the popular vote in 1968, 9.9 million, and captured 46 votes in the Electoral College. He did OK.

Friday, August 21, 2020

The COVID-19 death toll in NYC pales in significance compared with previous epidemics there, and that's as bad as it gets in the US this time around, at least so far

Deaths per 1000:

Cholera 1832: 46
Cholera 1834: 36
Cholera 1849: 46
Dysentery/Smallpox 1851: 38
Cholera/Smallpox 1854: 45
Smallpox 1872: 30
Smallpox 1881: 29
Spanish Flu 1918: 17

COVID-19 2020: 2.26 (18,998 confirmed deaths for population of 8.399 million) 

Thursday, August 20, 2020

Looting is reparations

"What if, one day, class war and race war joined forces to make an end of the white world?" -- Oswald Spengler, 1934

Sunday, August 16, 2020

COVID-19 Pandemic Deaths Update through 8/15/20

The 7-day growth rate for all COVID-19 deaths in the United States has averaged 0.62% for the ten weeks since June 6 and is flat at 0.65% in the last seven days.

The sum of deaths in the 15 worst states since the beginning of the pandemic has been flat for a month, averaging 779. The low so far was hit on Tuesday, August 11 at 773.  

The sum of deaths in the 10 second tier states since the beginning of the pandemic continues to edge slowly upward. Arizona, Mississippi, and South Carolina were each up one death per day since the beginning of the pandemic in the last week.

Adding the 15 worst to the 10 second tier we've fluctuated between 917 and 899 in the last six weeks since the Fourth of July, averaging 905 in the last five. The sum on 8/15 was 906.

Deaths continue to skew heavily 50 and older in US southern perimeter states. California is representative, where just 30% of the cases since the beginning have been 50 or older but 93% of the deaths. In Texas 35% of the cases and 92% of the deaths have been 50 or older.


Saturday, August 15, 2020

Climate Update for KGRR July 2020


Climate Update for KGRR July 2020

Max Temp 94, Mean 94
Min Temp 58, Mean 49 (tied for second highest minimum since 1892 with 2011 and 1921)
Av Temp 75.7, Mean 72.3
Rain 4.75, Mean 3.14
Cooling Degree Days 340, Mean 242
CDD Season to date 565, Mean 426

Back when I was in 'Nam Red Forman humor was funny


Wednesday, August 12, 2020

Conservative talk radio doesn't get it that Trump is president now

Both Todd Herman filling in for Rush Limbaugh yesterday and Michael Savage on his own show today keep talking about how law and order are going to disappear if Biden is elected and that Trump has to run on that issue.

But Trump IS president, and law and order have already disappeared.

A caller to Rush even pointed this out to Herman, who quickly changed the subject.

You can't run for re-election and win by promising to provide later what you're not providing now.

NOW.

It's the Limbaugh Theorem in action under a Republican president, pretending that the present problems aren't the president's problems.

Recipe for losing.

Monday, August 10, 2020

Losses due to George Floyd riots and looting to cost insurers over $1 billion, more than all the losses from riots and looting since 1965 combined


'Insurers have paid an estimated $1 billion in all for “riot” damages in local protests since 1965, according to Property Claims Services, an industry group. Insurers are bracing for new claims across the U.S. that they expect could total at least that much. Still, the group expects “manageable” losses compared to major hurricanes, which have cost tens of billions'.

How many looted cities will it take to re-elect Trump?

Inquiring minds want to know.


Sunday, August 9, 2020

The compound daily growth rate for US COVID-19 deaths bottomed on July 4th

Apart from the first week from the first death in the New York Times data at us-covid-tracker.com, Feb 29-Mar 7, the peak rate was achieved on Sat Mar 28 at 30.3%. The compound daily growth rate had dropped to just 3.2% by May 2.

This chart shows rates only after falling below 1% in order to show the current scale and the clear bottoming on Jul 4.

COVID-19 related hospitalization metrics in the four worst US states today are . . . NOT ALARMING

California is in blue in the graphs, Texas is in pink, Florida is in green and Georgia is in brown. Every one, though in the top four for current hospitalizations, has peaked and turned lower. Texas and Florida, the worst states for the outbreak currently, have turned sharply lower.

The sum of deaths from COVID-19 in the worst hit US states since the beginning of the pandemic has hit a new low, the same measurement in the second tier states continues to rise modestly


Wednesday, August 5, 2020

At least one American writer, Curtis Yarvin, was aware of Dr. Leung's warnings at the time, and stated what needed to be done even though he realized it wouldn't be

The self-described "foreign service brat" wrote for The American Mind, 2/1/20:


"The obvious solution to an emerging pandemic killer cold is cutting off flights to China, then all air travel across the Pacific, then across the Atlantic—depending on the virus’s progress . . ."

Dr. Gabriel Leung of Hong Kong University advocated for limiting mobility because he had worked out by Jan 27 how the coronavirus had already spread in China by rail

He was already warning of a global epidemic on Jan 27.

He was specifically worried on Jan 27 that flights out of China would seed the infection globally.

He was already aware of and demonstrated on Jan 27 how the novel coronavirus had spread in China by rail.

He was already stating there was clear evidence of human to human spread on Jan 27.

He was already advocating for "substantial, draconian measures limiting population mobility" on Jan 27.

He was already advocating for ending mass gatherings, for closing schools, and for requiring work from home arrangements on Jan 27.

And what were we doing?

The US Senate was finally hearing the House's impeachment case after Nancy Pelosi sat on it for weeks.

A country full of fools, run by fools.

The earliest example of someone advocating for a global flight stoppage was Hong Kong University's Dr. Gabriel Leung on Jan 27: "Substantial draconian measures limiting population mobility should be taken immediately"


Monday, August 3, 2020

The sum of average daily new deaths in the worst states appears to have bottomed, but it's still too soon to say for sure

I measure this weekly through Saturdays, and using Saturday 7/25 we did bottom, as the latest chart shows.

However, on Monday 7/26 the sum fell to 778, and 778 was just re-tested on Sunday 8/2.

So . . . we'll just have to wait and see what happens.

Clearly though the trend lower has slowed dramatically and is skipping along sideways for a week.