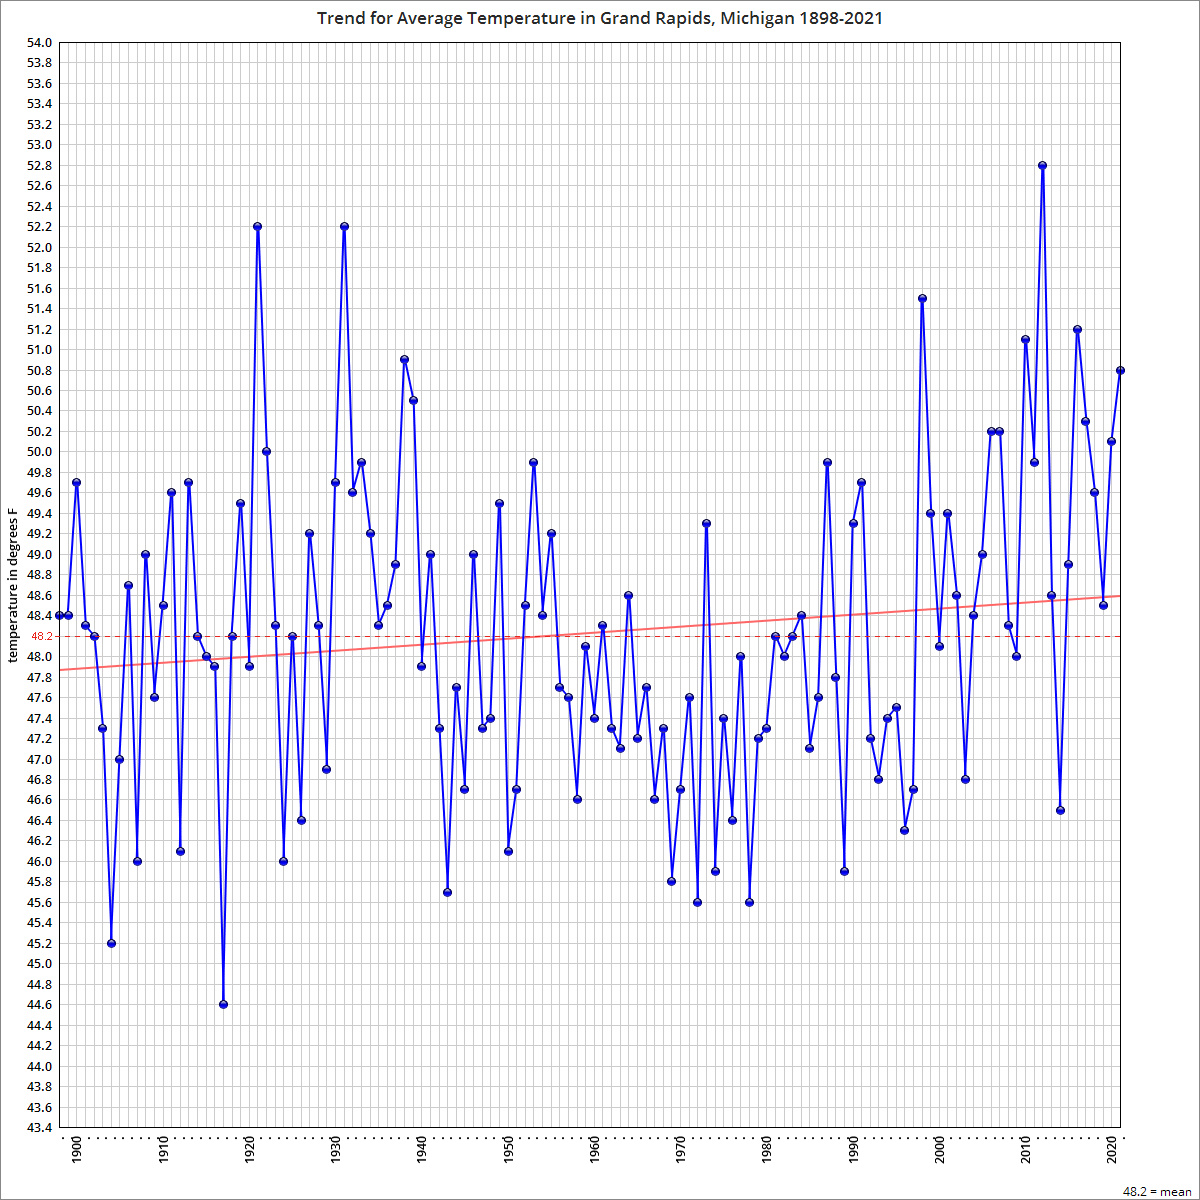
Given urban heat island distortions of +1 to +7 degrees F, average temperature rise of less than 0.3 degrees F above the mean since 1898 in Grand Rapids, MI is suspect (image D).
US EPA Heat Islands
page:
"A review of research studies and data found that in the United States, the heat island effect results in daytime temperatures in urban areas about 1–7°F higher than temperatures in outlying areas and nighttime temperatures about 2–5°F higher. Humid regions (primarily in the eastern United States) and cities with larger and denser populations experience the greatest temperature differences. Research predicts that the heat island effect will strengthen in the future as the structure, spatial extent, and population density of urban areas change and grow".
The US Historical Climatology Network station in Grand Rapids, Michigan, looks increasingly compromised by urban heat island effects. It is located at the Gerald R. Ford International Airport (image A), where the main 8,500 foot runway did not become operational until 2001 and where 2 million passengers were not served for the first time until 2004.
The weather station is located in the northwest corner of the 3,000 plus acre airport grounds at 4899 Tim Dougherty Dr, Grand Rapids, MI 49512 (image B). One can see it is now surrounded by industrial development to the north and west, the airport to the south and east, and a busy county road commission facility right east of the measurement station, which is accessed by a little walkway leading from the National Weather Service building (image C).
The county population has doubled in the last sixty years.
One can observe from the history of maximum temperature at the station (image E) that the trend is clearly lower by nearly 1.5 degrees F from the mean maximum over the whole period. The trend for minimum temperature is even lower, by over 2.0 degrees F from the mean (image F).
Click any image to enlarge.
 |
| A |
 |
| B |
 |
| C |
 |
| D |
 |
| E |
 |
| F |