Edward Lazear for The Wall Street Journal here has called attention to two months of back to back declines in average weekly hours, using the seasonally adjusted figures.
 |
| average weekly hours, not seasonally adjusted, quarterly average |
It got me to looking at the not seasonally adjusted figures, which do not show the same thing. In fact, they show that we've been flirting with the 34.3 level quite a bit in 2013, but also even since before the Great Recession, and before ObamaCare and the recent spate of nasty winter weather. But what is interesting is that the quarterly average of the figures shows that we failed to make a new high in average weekly hours last summer, breaking a pattern of ever higher highs in 2010, 2011 and 2012 which had developed after the lows in late 2009, early 2010. You'll also notice a pattern had developed of higher lows in the measure at the beginning of 2011 and 2012, but broken at the beginning of 2013.
 |
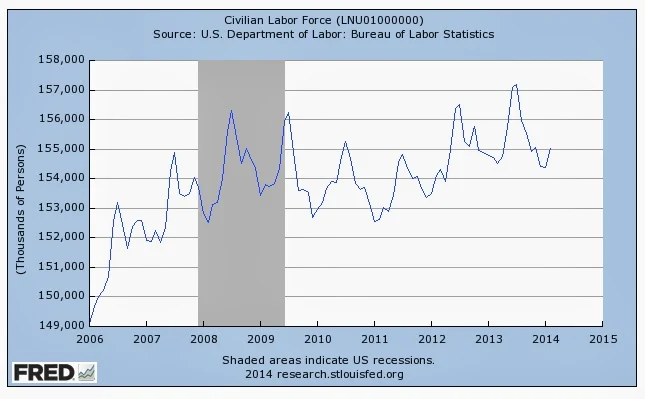
| civilian labor force level, not seasonally adjusted |
This is interesting because you can see this same pattern in the level of the civilian labor force. The post-recession level bottomed at the beginning of 2011 and made higher lows at the turn both to 2012 and 2013, but not to 2014, which appears to signify more than seasonal shrinkage. Similarly there's been a pattern of ever higher highs in the summers in 2011, 2012 and 2013, but if the pattern doesn't hold in the summer as it hasn't in the winter, we'll not beat the 2013 summer level in the summer of 2014.
It stands to reason that as the civilian labor force recovers and grows, which it has, average weekly hours should rise, which they have, until recently. But the recent weakness in hours probably goes hand in hand with recent weakness in the size of the labor force, not with something else, like ObamaCare or the weather. And that probably has more to do with flagging demand in the economy than anything else.
