Tuesday, April 9, 2013

US Prints Record 3+ Billion $100 bills in 2012

The US Bureau of Engraving and Printing issued a record 3.0272 billion individual $100 bills in fiscal year 2012, according to its website here. Production problems with the new $100 bill for 2011 release as reported here resulted in only $72.32 billion in $100 bills being produced in fiscal 2011. The $100 note is the most produced paper currency in the US, averaging $173 billion worth annually for the last five years.

The $100 denomination's print run in fiscal 2012 alone is worth $302.72 billion.

The total production figures since 2008 for all paper money are as follows, averaging $216 billion annually:

2008 $154.2 billion
2009 $219.5 billion
2010 $239.5 billion
2011 $109.7 billion
2012 $358.9 billion.

Since over 90% of the notes replace money which is or has been in circulation, on average about $21 billion annually is actually being added to the currency supply, which is peanuts in a banking system with in excess of $10 trillion in deposits.

It is reported here that total circulating cash presently comes to about $1.175 trillion, so it would take about 6 years to replace all circulating currency at current production levels, perhaps a little longer as some currency effectively disappears because it is destroyed in accidents, sold on the collector market, or hoarded, the latter becoming more popular abroad. Currency in circulation, however, appears to be up about 26% since 2010 when $930 billion was reported to be in circulation. That's an increase of $245 billion in just over two years, which is curious if it's true since one might expect an increase of barely $50 billion over that short a time.

If that is thought to be highly inflationary, however, the figure actually pales in comparison to the real money increase in the country since 2008, namely total credit market debt outstanding, which is up $4.5 trillion to October 2012.

Monday, April 8, 2013

Margaret Thatcher Was No Libertarian, Moving Leftward To Adapt Like Sen. Rand Paul

Marco Rubio, are you listening?

Ben Domenech, here:


Thatcher was originally seen as a Heath acolyte within the Tory wing, given a cabinet position in Education – but the distance between them grew, and she became closer to fellow Cabinet member Keith Joseph, forming a tiny band of back benchers disagreeing with the aims of the party leadership. ...


Heath’s approach failed at the ballot box. After losing the election in 1974 and failing to form a coalition government with the Liberal Party (a No Labels-esque Government of National Unity), he took it as a sign that the Tories had to move leftward in order to adapt to the opinions of the nation. Thatcher disagreed, and that made all the difference. When Joseph announced that he would challenge Heath for party leadership, Thatcher was the only Cabinet member to endorse him; when Joseph was forced to withdraw (thanks to demography comments implying the working class really ought to consider using birth control more regularly – the speech is here), he was forced to withdraw. So Thatcher insisted she would run. ...


The dominant assumption was that [Thatcher] would have to moderate to become acceptable to the British people. She did not. Instead, she repackaged conservative principles with a message of common sense and optimism, attacking nonsensical regulation, union dominance, and high taxes with verve. She promised hope and growth, not dour austerity, and insisted that acceptance of a nation in decline was a choice, not an inevitability.

Thatcher: "Socialist governments ... always run out of other people's money."


Llew Gardner:

There are those nasty critics, of course, who suggest that you don't really want to bring them down at the moment. Life is a bit too difficult in the country, and that … leave them to sort the mess out and then come in with the attack later … say next year.

Mrs. Margaret Thatcher:

I would much prefer to bring them down as soon as possible. I think they've made the biggest financial mess that any government's ever made in this country for a very long time, and Socialist governments traditionally do make a financial mess. They always run out of other people's money. It's quite a characteristic of them. They then start to nationalise everything, and people just do not like more and more nationalisation, and they're now trying to control everything by other means. They're progressively reducing the choice available to ordinary people. Look at the trouble now we're having with choice of schools. Of course parents want a say in the kind of education their children have. Look at the William Tyndall School—an example where the parents finally rebelled. Of course they did. These schools are financed by taxpayers' money, but the choice to parents is being reduced.

Look at the large numbers of people who live on council estates. Many of them would like to buy their own homes. Oh, but that's not approved of by a Socialist government …   . oh no! But that's absurd. Why shouldn't they? Well over thirty per cent of our houses are council houses. Why shouldn't those people purchase their own homes if they can?

-- February 5, 1976, Thames TV interview, here

Thatcher's Finest Hour: And So Say All Of Us

"She always afterwards regarded the Falklands War as the most important period of her premiership."

-- The UK Telegraph, here

"The Prophet Without Honor In Her Own Country": Thatcher Dead at 87

both free at last

'The second negative [which helped end her prime ministership] was [Mrs. Thatcher's] intransigent attitude to further European integration; this put her in a minority in her own party. But re-reading her strident speeches today gives no sense of them being out-of-date or belonging to a by-gone era. She dismissed the idea of a United States of Europe as a fantasy. I believed in it at the time, but now I see that she was correct. She thought that the European Union should be simply a free trade area with limited co-operation between sovereign nations. That is what an increasing number of us who were once fervent Europeans would like to get back to. As she said in a famous speech in Bruges that was widely criticised: “Working closely together does not require power to be centralised in Brussels or decisions to be taken by an appointed bureaucracy… We have not successfully rolled back the frontiers of the State in Britain, only to see them re-imposed at a European level with a European super-state exercising a new dominance from Brussels.”

'... [I]n light of the perpetual crisis in which members of the Eurozone have found themselves since the onset of the financial banking crisis in 2007 as a result of misjudged integration, those negative judgments now appear wrong. In this respect at least, she was an example of the prophet without honour in her own country.'


-- Andreas Whittam Smith in The UK Independent, here

Sunday, April 7, 2013

Since ObamaCare Was Upheld 2.03 Million Jobs Have Simply Disappeared

Ho-ney? I shrank the workforce!
The Supreme Court upheld ObamaCare on June 28, 2012.

Since July 1, 2012, full-time jobs are down 1.335 million over the eight months.

Part-time employment for economic reasons is down 607,000.

And part-time for noneconomic reasons is down 84,000.

So ObamaCare appears to be more negative for full-time jobs, but part-time employment is down also, by 691,000.

ObamaCare doesn't yet appear to be transforming the workforce into part-time. It just appears to be shrinking it, period.

Friday, April 5, 2013

Why Both Bush And Obama Were Re-elected

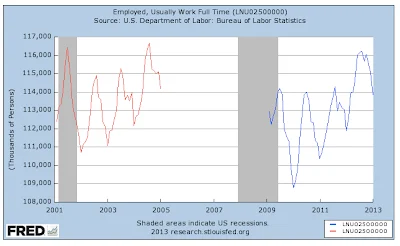
Bush and Obama both were re-elected in part because full-time jobs under their respective watches started and ended at almost precisely the same levels. Full-time employment was at 112 million and change at the beginning for each, and at 113 million and change at the end for each. 

Full-time jobs were up 1.6% under George W. Bush, and up 0.8% under Barack H. Obama.

Figures are for first terms beginning after accession to office through calendar election years, beginning on Feb. 1 and ending on Dec. 31.

Strange, but true. 

First They Came For Your Silver . . .

First they came for your silver (1964, last year minted).

Then they came for your dollar (1971, final year of dollar convertibility to gold).

Then they came for your tax deductions (1986 Tax "Reform" repealed deductibility of credit card interest).

Then they came for your mortgages (1997, introduction of two year rule to get you to borrow and churn).

Then they came for your banks (1999, allowed commercial banks to act like investment banks but with FDIC backstop).

Now they are coming for your bank deposits (2013, Cyprus), and not coincidentally, your guns.

Next it will be your 401ks and IRAs.

And then?

Of course there were other firsts before 1964, but these will do for now.

Economic Impact Of Lost Full-Time Jobs Since 2007

The level of full-time jobs for the five years between 2008 and 2012 has averaged about 114.2 million.

Peak full-time was 123.2 million in July 2007, so the average level is down from the 2007 peak by 9 million.

Average hourly earnings for all employees in the private sector for the period is about $22.60, or $47,008 per annum.

Times 9 million jobs that's $423.1 billion per year, or $2.12 trillion over the five years.

That's simply the payroll cost savings to American business, without adding in savings from no longer having to pay Social Security matching, unemployment insurance and workmen's compensation insurance premiums, and all the other benefits like health insurance, retirement and the like. The savings to business could easily have reached $2.5 trillion to date.

If you are wondering where business got the $1.2 trillion it has used for stock buybacks during the crisis, now you know.


March Unemployment Drops To 7.6%, Full-Time Work Still In Depression

You talkin' to me?
The full pdf report from the Bureau of Labor Statistics is here.

The official number of unemployed fell to 11.7 million from 12.0 million last month, but nearly 500,000 left the civilian labor force in the seasonally-adjusted measure. In the raw measure the civilian labor force participation rate is down to 63.1%, the only other example of which in the data going back to 1948 was in July 1976. Those not in the labor force rose year over year by about 2.5% to almost 90.5 million.

Multiple job-holding is up barely 2% year over year in the report. Full-time with a secondary part-time job is up 7.7% year over year. Holding two part-time jobs is down 7.9% year over year. Part-time for both voluntary and involuntary reasons is not much changed year over year: Voluntary is up about 1.2%, involuntary is actually down less than one half of one percent in the seasonally-adjusted category, but down 1.7% in the raw numbers. . . . I'm not yet seeing any convincing evidence in the data to date that ObamaCare is part-timing the country in general. Full-time by either measure is actually up a little, by about 0.7% year over year.

Total nonfarm employment is either 134.5 million not-seasonally-adjusted, or 135.2 million seasonally-adjusted, up less than 1.5% year over year. Peak was in January 2008 at 138 million seasonally-adjusted, so the depression in employment continues, driven by the loss of full-time jobs, which in the raw measure are still down 8.4 million from the July 2007 peak, or 6.8%.

Jobs added per month on average for the last year has been at the level of 169,000. Both January and February saw upward revisions to the previous reports of jobs added in the neighborhood of 30,000 each month. Jobs added in March at 88,000 looks like a big stall in the trend, but we'll have to wait a month or two for the revisions to say that with certainty.

At the current rate of job addition, Obama will be long gone (one hopes) before full-time jobs come back. Of the 169,000 jobs added per month on average in the last year, only somewhere between 63,000 and 73,000 are full-time per month based on the year over year gains in full-time. Call it 68,000 per month, that's 816,000 per year, so it will take only 10.3 more years to add back those 8.4 million full-time jobs we're down and get us back to the level of 2007 . . . in the year 2023.

Way to go, Brownie!

Thursday, April 4, 2013

The Line of the Day: "I'll Bet Romney's Had Coffee"

Callahan doesn't take sugar in his coffee.

"He just didn't swallow."


h/t 'Nita

Wednesday, April 3, 2013

Gold: Over 60 Million Krugerrands Circulate, More Than All Others Combined

So says the Rand Refinery's latest brochure, here, showing 2012 mint specimens. Figures through 2008 previously indicated 46 million ounces minted.

These 60 million Krugerrands are not all 1 oz. coins, but if they were, that would mean something like $96 billion worth with current gold prices around $1,600 the ounce.

Presumably therefore, there must be something like 110 million gold coins of all kinds out there if Krugerrands represent more than all the rest combined, with a current value of roughly $176 billion.

Not very much real money when you get right down to it.

Of course, there's lots of bars out there which can be turned into coin.

Official global gold reserves as of last summer were approaching 31,000 metric tons (2,204.6 lbs each), for a grand total of 68,342,600 lbs, which is 1,093,481,600 ounces, in other words, potentially about 1.093 billion more gold coins, with a current estimated value of $1.75 trillion.

Add the current gold coinage and you've got a potential $1.93 trillion in gold money for the world at current prices, 1.2 billion one ounce gold coins, or 12 billion tenth ounce gold coins, or 1.6 tenth ounce gold coins for every man, woman and child on the planet (7.1 billion), or $256 each.

Equality is such a bummer.

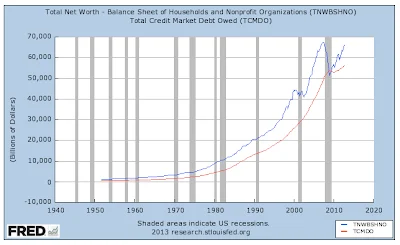
Meanwhile at home, current net worth of US households and non-profits in US funny money is $66.072 trillion, or $210 billion for every man, woman and child in the country.

Now, that's more like it!

Forbes: The Fed Is The Most Hypocritical, Thieving, Incompetent Bank In The Country

Richard Salsman for Forbes here savages the thieving, incompetent US Federal Reserve for its utter hypocrisy in keeping comparatively well-capitalized big banks from paying out dividends when its own balance sheet is the most under-capitalized of all and pays out 100% of what it makes.

Not news, but it bears repeating as often as possible, especially when it's stated so well:

'[I]n the century prior to the Fed’s founding in 1913, U.S. commercial banks were far more liquid and far better capitalized; in the century since 1913, however, and especially since the FDIC was established in 1934, the banks’ liquidity and capital adequacy measures have steadily deteriorated. This artificial, policy-induced financial precariousness has been used routinely as a pretext to justify onerous regulations – which, it’s easy to notice, have never quite adequately curbed all the excessive risk-taking and hence periodic banking crises. Bank executives often oppose the onerous regulations, but not the government subsidies which invite them. ...


'What about the Fed? It’s now got the biggest balance sheet of all the major banks in the U.S. – $3.1 trillion in total assets (versus $2.2 trillion at Bank of America, the largest private-sector bank in the U.S.) – and yet the Fed also has only $55.1 billion in capital (versus $160.3 billion at Bank of America). That means the Fed’s capital/assets ratio is a mere 1.8%, less than a quarter of the average capital ratio for the top eighteen banks subject to CCAR (8.0%) and of the three banks recently deemed inadequate (8.2%). The Fed’s capital ratio is only 15% of the ratio of BB&T (11.5%), the most-capitalized of the top private banks. Moreover, the Fed’s dividend payout ratio is hardly conservative or capital-preserving (like 10-33%); it is a 100% payout, since the Fed pays all its income (mainly from Treasury bonds, notes and bills), none of which is taxed, straight to the Treasury. Whereas the Fed is leveraged 56:1 (liabilities/capital), the top eighteen banks are leveraged by just 12:1 (average), while the three censured banks are leveraged by only 10:1 (average). ...

'This is the same Fed which, over the past century, has debased the dollar to such a degree that it’s now worth only 5% of its initial real purchasing power in 1913 (whereas the dollar in 1913 was approximately as valuable as it was in 1813, because it was anchored by the gold standard, not by a flimsy Fed standard). This is the same Fed that Alan Greenspan touted in a 1996 speech as “the ultimate guardian of the purchasing power of our money.” Is it truly a “guardian” – or instead an incompetent, or perhaps a thief – who presides over a loss of 95%? This is the same Fed which now censures private banks for having capital levels many times greater than the Fed’s own capital level. Isn’t it high time we ended the hypocrisy whereby the politically-financially reckless among us rule the day?'

The big banks' off-balance-sheet assets make their capital ratios much worse than stated above, but that just makes them more like the Fed in that respect. Salsman points out that before 1913 when we still had true, private banking, capital ratios averaged 20%+, whereas today 8% is about as good as it gets. 

The Nation: Bill Clinton Wrecked The Economy, Not David Stockman

So Robert Sheer, here:


It wasn’t Stockman who wrecked the economy. It was Bill Clinton who deregulated the too-big-to-fail banks, and it was George W. Bush and Barack Obama who bailed them out. But even Paul Krugman, who knows how bad things are and yet manages to be charitable in appraisals of his Princeton colleague Ben Bernanke, dismisses Stockman’s critique as “cranky old man stuff. ...” ...

Herein is a lesson that the bankers should have been taught back during the Clinton presidency when, as Stockman writes, the principle of a bailout for Wall Street’s hustlers “was reinforced by the Fed’s unforgivable 1998 bailout of the hedge fund Long-Term Capital Management.”

That fiasco’s enablers—Alan Greenspan, Robert Rubin and Lawrence Summers—and the more disastrous ones to follow were crowned “The Committee to Save the World” on Time magazine’s Feb. 15, 1999, cover and are still welcomed in those polite circles where truth-teller Stockman is being treated as a pariah.


Corporations Borrow Cheap, Drive Market Highs Since March 2009 With $1.2T In Buybacks

So reports CNBC.com here, stating individual investors by contrast have pulled out $250 billion:


Corporate stock purchases have been the principal driver of the market's surge off its March 2009 lows, as companies have helped levitate prices through nearly $1.2 trillion in buybacks since the beginning of the third quarter in 2009, according to Standard & Poor's data.

During that same time, individual investors have pulled a net of more than $250 billion out of mutual funds, according to records from the Investment Company Institute that indicate the retail crowd has mostly fled the stock market and put the bulk of its money in cash or bonds. Mutual funds are seen as a proxy for mom-and-pop investors who use funds and 401(k) plans to put money into the market.


Companies have been able to be so aggressive because the Federal Reserve has kept money cheap. The U.S. central bank has held its target funds rate near zero to maintain low borrowing costs, while it also has flooded financial markets with more than $3 trillion in liquidity through money creation.

Tuesday, April 2, 2013

American Women Abort 3,300/Day, But These Two Think White Men Are More Violent

The clueless Childresses, here:


"Nearly all of the mass shootings in this country in recent years — not just Newtown, Aurora, Fort Hood, Tucson and Columbine — have been committed by white men and boys. Yet when the National Rifle Association (NRA), led by white men, held a news conference after the Newtown massacre to advise Americans on how to reduce gun violence, its leaders’ opinions were widely discussed."

Total Credit Money Creation Has Stalled Since 2007

Total credit money creation, aka total credit market debt outstanding (TCMDO), has stalled since 2007.

Doubling time for TCMDO has averaged 8.25 years between 1949 and 2007. The longest doubling times were 11.5 years from 1949 to 1961 and 10 years from 1989 to 1999. The shortest two episodes were each six years long: from 1977 to 1983, and from 1983 to 1989.

Real GDP over the longest periods increased 56% and 36% respectively. Over the shortest periods it increased 14% and 28% respectively.

Since 2007 TCMDO is expanding at a crawl, comparatively speaking, up at just 12% for the five years ended in July 2012. Real GDP for the period is a pathetic 3%.

At the current snail's pace, $1165 billion per year for the last five years, it will take until the year 2050 for TCMDO to double again.

Current quantitative easing programs continued indefinitely at the current rate of $1020 billion per year are as unlikely as previous iterations to lead to the expansion of TCMDO. The transfer mechanism is broken because the credit money creators, the banks, now prefer the option of investing elsewhere, which they did not have before 1999. The only way to fix that is to overturn Gramm-Leach-Bliley, and to reform mortgage lending. 

Credit money, the lifeblood of the nation, is not even reaching the veins, let alone flowing through them at a rate sufficient to generate any GDP heat.

Monday, April 1, 2013

Ben Bernanke Is Trying But Failing Miserably At Money Printing

And it's not exactly his fault.

Historically in the postwar period, the increase in Total Credit Market Debt Outstanding (TCMDO) has closely shadowed the increase in Total Net Worth, seemingly helping to finance it, until the late great recession when for the first time, and very briefly, net worth flagged below the level of the debt owed. (Ignoramuses in the Doomosphere everywhere cried "Insolvency" at the time, not understanding the meaning of the term "net"). Ex post facto, net worth has made a dramatic upswing while the debt owed has increased at a much reduced rate by historical standards. To quote a famous president, "That doesn't make any sense."

Despite all the debt naysayers out there, total credit market debt is not increasing at anything like it should be, and appears to be disconnected to a significant degree from the recent increase in total net worth, which is up 29% since its nadir at the beginning of 2009, or $14.7 trillion. For the whole five year period from July 2007 (the last time TCMDO doubled, going back to 1999) to July 2012, TCMDO increased at a rate of just 12% and real GDP increased just 2.9%, whereas TCMDO increased at a rate of 100% between 1949 and 2007 on average every 8.25 years. The shortest doubling times have included two periods of 6 years each, one of 6.75 years, one of 8 years, one of 9.5 years, one of 10 years, and one of 11.5 years. The very worst real GDP performance of all of those was for a 6 year doubling period when we got 14% real GDP, nearly 5 times better than we're getting now. All the rest posted real GDP of between 23% and 56%.

It is evident that Ben Bernanke's quantitative easing program (right scale) anticipated the leveling off of TCMDO (left scale). Clearly he expected the troubled banks to need a push to keep the credit money creation process going, but didn't understand how fruitless it would be. One notes that he has added about $2 trillion to the monetary base from the middle of the late great recession. By contrast, TCMDO is up (only!) $9 trillion from the beginning of 2007. By historical standards TCMDO should be up $25 trillion by now if TCMDO is to double again in ten years from 2007. And it should be up a lot more than even $25 trillion by now if it's to double sooner than ten years. At the average doubling time of 8.25 years, the $49.8 trillion of TCMDO in July 2007 should hit $99.684 trillion by October of 2015 if the postwar pattern is to continue. Instead, at the current rate of growth in TCMDO, it's going to take an unprecedented 27 years to double it, unless of course there are limits to borrowing to fuel growth, as many are beginning to tell us. In either event one can only assume there will be only pathetic real GDP growth going forward, if there is any at all.

Clearly something is horribly amiss in the transmission process of credit money creation for the first time in the postwar. Seemingly gargantuan quantities of money from the Fed through the process of quantitative easing should be seeding the banks who in turn should be creating massive amounts of credit way beyond the $9 trillion so far created. Instead, the banks are doing something else with it, by-passing the normal distribution channel. Some of the seed money is being held back to comply with increased capital requirements, to be sure, but more appears to be going directly into household net worth creation through investment gains from the stock market, enriching a very few bondholders, shareholders and banking industry players through the private trading desks of the banks, a unique development by historical standards made possible only since 1999 with the abolition of Glass-Steagall through the Gramm-Leach-Bliley Act. As an act of Congress, Ben Bernanke can't do much about that even if he is the most powerful man in the country.

In the absence of a creative policy change from the Fed whereby Congressional intent would be thwarted and money would actually reach the marketplace through a different avenue than the uncooperative banks, one must conclude that the Fed thinks it necessary to continue the various easing schemes because it judges the banks to be still too fragile to risk stopping them. That would be putting the best construction on the matter, to borrow a phrase from Luther's catechism. Either that, or the Fed itself has been completely captured by the bankers.

Cyprus: "Punishing A Whole Country Just To Hit Russians"


'Particularly successful at luring Russians, Cyprus has built up a large infrastructure of lawyers, accountants and other professionals schooled in the arts of tax avoidance. Its corporate registry now has 320,000 registered companies, a staggering number for a country with only 860,000 people. Most are hollow shells set up for foreign companies and wealthy individuals seeking to avoid taxes.

'"We have been thrown to the wolves, and now the wolves have responded," said Nicholas Papadopoulos, who heads the financial and budgetary affairs committee in the House of Representatives.

'Bitterly critical of last week's bailout deal — which is forcing Cyprus to shrink its banking and financial services industry drastically and stick the largest bank depositors with much of the bill — Mr. Papadopoulos said the European Union was "punishing a whole country just to hit Russians."'

More here.

Developing Countries Bail Out Of The Euro Big Time Since 2009


"The choice of where to hold reserves sends a clear signal of which currencies developing countries regard as the most stable, safe and liquid. Euros now make up only 24 percent of their reserves, the lowest since 2002, and down from a peak of 31 percent as recently as 2009. The dollar has held steady at about 60 percent."

Read the rest, here.