Wednesday, January 7, 2015

TARP ends, but conservatives still don't realize it was just a sideshow

Existing crisis loans 1st of the month in billion$
That TARP was just a sideshow was not known at the time in 2008, but it should be known by now.

Too bad conservatives haven't paid attention.

TARP assumed the role of the main actor on the stage of the financial panic as the liberal government of George W. Bush tried to show that it was capable of doing something to bring the panic of 2008 to an end. Bush at length signed the TARP legislation on October 3, 2008, at which point the stock markets promptly rewarded him by caving over the next three weeks, setting the stage for the final denouement by March 2009. Only Securities and Exchange Commission changes to mark-to-market accounting rules at that point stopped the cratering and put a floor under stock prices. Meanwhile behind the scenes the liberal government of Woodrow Wilson in the form of the Federal Reserve had already been hard at work for months frantically doing the real rescue.

Now that TARP is over, liberal political operatives are wont to characterize TARP as a success because it supposedly made a profit accruing to the government, and hence to The People, who are ever almighty in liberalism. They also say this to keep our eyes off the ball. "Conservatives" continue to take that bait and argue there was a loss to TARP, never examining themselves to see if they are in the larger truth. National Review's Matt Palumbo is just the latest example, here, quibbling over a few measly billions of dollar based on an argument from inflation to substantiate a loss to TARP.

It doesn't get much more pathetic than that.

TARP became the sideshow it always was once and for all when Bloomberg News, using the Freedom of Information Act, forced the Fed long after the fact in late 2010 and early 2011 to reveal the true scope of its bailout of the world in 2008-2009. Behind the scenes the rest of us had groped in the dark trying to fathom TARP's $700 billion bailout, when that turned out to be just a decimal point in the real bailout, the Fed's $7.7 trillion lending authority through the discount window and other programs.

"Conservatives" still haven't grasped this.

Over five million Americans lost their homes in the wake of the panic, almost 30 million ended up filing first time claims for unemployment in 2009 (85% more than did just last year), and almost eight years after the employment peak of 2007 full-time jobs still have not recovered, the most disgraceful record in the post-war.

The Federal Reserve bailed out hundreds upon hundreds of large banks and corporations not just in the United States but all across the globe by backstopping them with promises of huge sums if needed while regular Americans were simply left to fend for themselves:

$7.77 trillion -- The amount the Fed pledged to rescue the financial industry, according to Bloomberg research that examined announced, implied or actual upper limits on lending and guarantees. This number, which represents potential commitments, not money out the door, was first published in March 2009, when it peaked.

“One of the keys to understanding why we’ve avoided another Great Depression, so far, is to see how bold the Fed was in 2008 and 2009,” said Niall Ferguson, a Harvard University history professor. “That boldness consisted of a range of contingency commitments that backstopped the banking system. Just because they weren’t used doesn’t mean they weren’t important.”

---------------------------------------------------------------------------------------------

Actual loans at rock bottom prices over time amounted to about half that, at $3.3 trillion, as can be appreciated here in just one of the lending programs of the Fed, the famous discount window. The low interest rates charged there, a sideshow in themselves, are thought to have benefited the banks at the same time by about $13 billion, according to Bloomberg, over what they would have had to pay at market rates.

That was simply the cherry on the gargantuan crony capitalism cake, an object, I am sure, of singular fascination for the likes of the Matt Palumbos of the world.

That spike in the graph is the discount window lending in the 2008 panic


Tuesday, January 6, 2015

John Early's model predicts 4Q2014 GDP between -1.2% and +1.4%

See John Early's "5 Reasons GDP Growth in Q4 May be 0%" at Seeking Alpha, here.

The House has a Boehner again


Top 10 investing years for subsequent 10 year returns since 1965 to date

1988: 18.80% nominal per annum average from the S&P500 12/'88-12/'98
1987: 18.15%
1989: 17.99%
1990: 17.57%
1979: 17.27%
1981: 16.53%
1982: 16.16%
1978: 16.14%
1977: 15.02%
1985: 14.98%

These years have an average total S&P500 market capitalization to GDP (in trillions) ratio of 48.

The ratio at the end of 3Q2014 was 112, which historically produces 10 year returns averaging about 3.24% nominal.


Monday, January 5, 2015

Rush Limbaugh is back for 2015 and he's dumber than ever, just like Zero Hedge


And the second thing I saw was the economy is growing at this 5% rate.  By the way, do you know how that happened, folks?  Do you know what the bulk of the economic growth -- I mean, what is the economy?  The economy is consumer spending, essentially, consumer spending and consumption, commerce.  You know what the majority of spending was in the fourth quarter was people spending money on Obamacare, mandated by law.  The vast majority of our economic growth -- this was made public by Tyler Durden at -- I forget the website.  It's off the top of my head.  Well-known business website.  Over half of the spending in this country in the fourth quarter was you and me and everybody else spending money on health care. ... Well, some economic growth, when over half of it is essentially required by the government? 

---------------------------------------------------------------------------------

Aside from the fact that the quarter in question is stated in error as the fourth, the idea that "the majority of spending . . . was people spending money on Obamacare" is ludicrous.

Line 17 in the snapshot above from the GDP report shows that 3Q2014 healthcare spending was $2.0089 trillion. Line 2 shows the total of all personal spending at $12.002 trillion. Healthcare spending thus represented just 16.7% of that in 3Q. And that percentage is identical to the percentage spent also on healthcare in 2013. Healthcare spending is not anywhere near "over half of the spending in this country in the fourth [sic] quarter".

ObamaCare hasn't suddenly driven up healthcare spending in 2014 at all. Maybe after the fourth quarter is over and we get the final number for that in March 2015 we will be able to say that Obamacare has driven up healthcare spending overall, but so far we cannot say that. So far such increases have been born by too small a percentage of the adult population to show up in the data.

What we can say is that so far healthcare spending is growing at a pace slightly behind the pace of the overall economy, which grew at 4.96% annualized in 3Q. Healthcare spending grew at a slightly less robust 4.6% rate.

It is likewise incorrect to say as Rush Limbaugh says that healthcare spending accounts for "the bulk of the economic growth" in 3Q. Healthcare spending grew $88.6 billion in 3Q2014 from 2013, which represents just 10.65% of the $831.7 billion overall increase in GDP over 2013 in the latest report. Over 89% of the increased growth thus came from other categories.

Conservatism is not about fighting lies with more lies.


John Tamny of Forbes spends four pages trying to convince us falling oil prices are always due to a rising dollar

Here, in Forbes:

"Falling crude prices ... were a function of a rising dollar that revealed itself in a major decline in the price of gold that is and was priced in dollars."

I don't know. Maybe he's trying to convince himself, not us. Reminds me of listening to a religious fanatic who can't stop talking. You know the kind. They usually get older and eventually think the better of it and move on. But not John Tamny.

The idea that a falling dollar produces higher oil prices is a nice theory occasionally supported by the data. The trouble is, there are too many examples of the correlation breaking down.

Crude oil prices from the mid-1980s to 2004 were remarkably range-bound between $12 and $35 a barrel despite the huge drop in the dollar from 1985 and its subsequent rise through the early 2000s. The dollar's rise in the late 1990s did nothing to change this. In fact, oil rose in tandem with the dollar then, as it did marginally after 1995 and as it did at the end of the late recession.

The sheer scale of the moves in oil prices is not commensurate with the relatively small moves in the dollar since 2005, nor is the relative tranquility of oil prices before that explained by the out-sized moves in the dollar.

The case is similar with gold, which at the current price of the dollar is still much, much higher than a dollar at this level in the past would indicate is called for. Gold was quiescent for 20 years and a lot lower than now all the while the dollar moved dramatically down and up again and down, off the 85 level. Contrary to Tamny, the recent decline in the price of gold has hardly been major, and hardly enough to convince that it is hewing to the performance of the dollar.

To illustrate how little gold has cared for the dollar's level, just look at how long it took for gold to peak after the 2008 all-time low in the dollar: over three years. And there is also that roughly 13 point rise in the dollar during the late recession when gold also began its long and biggest leg up.

That's not supposed to happen.

Sorry!


Sunday, January 4, 2015

What does stock market valuation in 2014 portend for the future?

Using the S&P 500 index level at the end of 3Q2014 divided by the final report of GDP in trillions of dollars you get a ratio of 112. 

To put that in its proper context from 1965, the mother of all buying opportunities at the end of 1981 produced a level of 38 and the outlier year at the other end of the scale was 1999 at the end of which the level stood at 152. So 112 is well north of the Mason-Dixon line of 95 for this analysis.

The nominal average return per annum for the ten years from the end of 1981 was 16.53% with dividends fully reinvested, but from 1999 it was . . . wait for it . . . -0.73%.

Similar levels to 2014 have obtained at the end of 2001 (108), 1997 (113), 1968 (110), and 1967 (112). The respective subsequent 10 year average returns have been 2.79%, 6.02%, 2.81% and 3.49%, for an average of these of 3.78%.

In other words, the future doesn't look so hot. 

Stock market valuation illustrated by total market capitalization to GDP ratios, selected years


"Steven Goddard" has a little fun with WaPo for Alaska temperature alarum

Yeah, where are all the stories about last winter? All gone, down the memory hole.


"The US recorded [in 2014] the most nights below zero since 1989, but Anchorage now represents the global climate."


Saturday, January 3, 2015

Dollar soars almost a percent to close at 91.15, highest close since December 2005


Grand Rapids, MI, finishes 2014 with a total temperature anomaly of -30.3 degrees F

December was 2.7 degrees F above normal and nearly snowless with just one inch, most of which came on December 31st, a welcome respite from the all-time record snows of November at 31 inches, accompanied as those were by below normal temperatures totaling 5.8 degrees F.

The temperature deficit from normal through November of 33 degrees F was thus reduced to 30.3 degrees F total for 2014, for a monthly average deficit of 2.525 degrees F.

Collapsing oil prices will blow a $1.4 billion hole in Canada's tax revenues, wiping out the projected surplus

So says Garth Turner, here, at The Greater Fool:

Fully 30% of the pump price is federal and provincial tax, of which 12% goes to Ottawa. It’s now clear that with buck-a-litre gasoline that Canadians will spend about $12 billion less filling up in 2015 than last year. There alone is $1.4 billion Joe Owe won’t have to play around with – and he was forecasting [a] surplus of less than a billion.

---------------------------------------------------------------------

Nice nuts on the truck, Garth.

Market valuation in 2014 is 15% above the 2007 level

Average market cap to GDP in 2006 and 2007 came in at 1.23, and then fell to 0.74 by the end of 2008.

As of the end of 3Q2014, the ratio has risen to 1.415, which is 15% above the level seven years ago before the stock market crash, and 91% above the 2008 level.

Current valuation is about 17.5% below the stratospheric level of 1.715 reached at the end of 1999, and almost 195% above the 1981 level at 0.48, the mother of all buying opportunities in our lifetimes.

Buy and Hold: Why bother with Bridgewater's All Weather or with a simple global market portfolio?

Meb Faber compares the returns from behemoth Bridgewater's All Weather portfolio to a simple global market portfolio (GAA) here, acknowledging that the leveraged version of the latter which beats All Weather is probably too expensive for individuals to implement:

All Weather, 1996-2014: 6.34% net of inflation
GAA (unleveraged), 1996-2014: 5.23% net of inflation.

I say, why bother?

You can invest very cheaply in a low-cost S&P500 index fund and do very nearly just as well on the stock side: The average annual return from the S&P500 net of inflation, 11/'95-11/'14, has been 6.23%.

And for the bond portion of your portfolio an investment in a low-cost long term bond index fund like VBLTX has yielded 7.89% since 1994. Net of inflation at about 2.31% this must come in in the neighborhood of 5.4% per annum.

Which begs the question, Why not just pick a decent low-cost balanced fund?

Actively managed Wellesley Income, VWINX, has yielded 10.09% per annum since 1970, with inflation annualizing at about 4.17%. And the traditional Balanced Index, VBINX, has yielded 8.38% since 1992, with inflation annualizing at about 2.38%. Either fund puts you in the vicinity of 5.9% to 6% per annum net of inflation. Expense ratios for these funds are less than a quarter point.

Just sayin'.

Friday, January 2, 2015

Tonight's S&P500 level is 0.8% above the inflation-adjusted August 2000 level, the previous high

2058 vs. 2041.

Mario is dead: Long live the Mario

Mario Cuomo (1932-2015)

Happy talk from Robert Lenzner of Forbes misses the 180 month bear market in performance

Robert Lenzner of Forbes, here, is only off by an order of magnitude (18 months vs. 180):

Bull markets last on average about 97 months each and gain an average of 440 points in the Standard & Poor’s 500 stock index. By comparison bear markets since the 1930s have an average duration of only 18 months and an average loss in value of about 40 percent.

Let's talk the most recent bear market in performance.

If you invested your nest egg in the stock markets fifteen years ago in a total stock market index fund, your average return annually, say in VTSMX, would be 4.75% through 2014, per Morningstar.

On the other hand, if you had taken the safe route and invested everything in an intermediate term bond index fund, say in VBIIX, your average annual return would be 6.52% through 2014, also per Morningstar.

DESPITE THE PHENOMENAL PERFORMANCE OF STOCK MARKETS SINCE 2011, WHEN THE S&P500 REVISITED THE 2008 CLIFF LEVEL BEFORE THE BOTTOM IN 2009, STOCKS ARE STILL IN A BEAR MARKET. NO ONE REALISES HOW BAD THEIR CONDITION STILL IS.

Only fools are investing in the stock market today. Returns from stocks 10 years from now will be similarly disappointing as they have been since 1999. If you have physical gold, keep it, imho. And if you can, raise cash, imho. Opportunities for riches to agile investors who are prepared to scoop up bargains as in the 1930s are in the offing.

As everyone should know by now but doesn't, 1999 was a blow off top period leading up to the previous inflation-adjusted stock market peak of August 2000.

Valuations today have still not reproduced themselves in comparison to the end of 1999 on a total market cap to GDP basis, but they are way above the 2007 levels and represent an historically exceptionally rarefied level of valuation. Valuation at the end of 2014 based on total stock market cap to GDP will be relatively certain with the second report of 4Q2014 GDP at the end of February.

Stay tuned.

Erick Erickson asserts a difference between libertarianism and libertinism

Today filling in as guest host of the Rush Limbaugh Show in response to a caller recommending the Republican Party move in a more specifically libertarian direction.

The comment was more diplomacy than wisdom.

In the Molly Ball feature on Erickson for The Atlantic here, Erickson more than once eschews libertarianism, let alone libertinism:

“Nationally, people think of me as a Tea Party person, and I am,” Erickson told me. “But in Georgia, the Tea Party can’t stand me.” The local movement, he explained, is dominated by libertarian followers of former Congressman Ron Paul, and Erickson has opposed many of its chosen candidates. Erickson’s conservatism is of a more traditional bent, deeply informed by his evangelical faith. He believes Republicans must not yield in pursuit of small government, strong national defense, and the primacy of the traditional family.

Erickson sounded almost gleeful as he told me about the Tea Party hating him. He seems to delight in confounding expectations, and in almost every way, he refuses to be pigeonholed: he is a southerner who defines himself by his small-town sensibility, but he spent most of his childhood in Dubai. He speaks for the conservative grass roots, but he pals around with cable-news regulars and Beltway elites. He’s a strict no-compromises ideologue, but during his one foray into elected office, he was a model of bipartisan cooperation. ...

When I pressed him on whether his zeal for regulation while on the city council was at odds with his less-government philosophy, he said he believed human trafficking was a problem that government should have a role in solving. “I’m not a libertarian,” he said. Even small-government absolutists, after all, can agree that sexual slavery ought to be prevented.

Index fund flows in 2014 may indicate the top is in, or nearly in

Seen here:

The impact of index funds has been revolutionary. When John Bogle, the founder of Vanguard, introduced the first vehicle designed to passively track the performance of a stock index about 40 years ago, it was derided as “Bogle’s Folly.” Today the fund’s successors, at Vanguard and elsewhere, hold $2 trillion in assets. ...

Actively managed funds still hold a majority of total stock fund assets, 63% at the end of September. But in the first nine months of 2014, actively managed stock funds attracted $2.5 billion, while $173 billion found its way into index funds, or 98.6% of the total.

This flood of money into index funds came after the market already had recorded substantial gains. [James] Stack contends that such lopsided affection for passive investing — and the lack of concern for risk that he infers from it — hints at an approaching top, as does the evidence of history.

“Generally, the times when index investing reaches the highest popularity are in aging bull markets or near market peaks,” he says.

Thursday, January 1, 2015

Social Security disability rolls are growing annually 9.1% more on average under Obama than under Bush

The average annual addition to the disability rolls under Bush, who added 2.7 million over eight years, was 342,000. Under Obama, who has added 1.9 million over five years through 2013, the average annual addition has been 373,000. The current program total is 12.156 million through 2013. If the 2014 addition rate is similar to the immediate past, the program total is probably close to 12.5 million as of December 31st.

The latest statistical report for the program, released in December, may be viewed here.

Figures cited above are derived from Table 1, page 17, disabled beneficiaries and their non-disabled dependents. Table 66 figures are higher and include the disabled aged 18-64 who also get Social Security and/or Supplemental Security Income, the average cost for all of which in 2013 came to $161 billion. 

Total stock market capitalization through 12/31/14 is $26.004 trillion

Wilshire 5000 level X 1.2

Updated: Global middle class hits one billion in 2014, but has actually declined since 2010

So reported the Times of India here in October:

Credit Suisse's Global Wealth Report 2014 released on Tuesday says that there are one billion adults at present who belong to the middle class - with wealth anywhere between $10,000-$100,000 range.

The Global Wealth Report 2014 itself may be viewed here, from which the pyramid at the left.

Notice the relatively small size of the global middle class, just 21.5% of the world's adults, with the vast majority of these coming first from China, and then second from the Asia-Pacific region, followed by Europe, Latin America and North America in that order, according to the details on pages 24ff.

Update: The inaugural Global Wealth Report in 2010 here actually showed a LARGER global middle class adult population of 1.045 billion then vs. the 1.01 billion today, a 3.3% decline. As a percentage of the world's adult population, the middle class share also has declined, from 23.5% of all adults in 2010 to 21.5% in 2014, a decline of 8.5%.

22 States and DC raise minimum wage this year: Expect teen employment to remain in depression or decline further

Teen employment levels today at 4.6 million are still 2.9 million below their 2006 peak of almost 7.5 million.

This is not just an artifact of the 2008 Panic.

The Federal minimum wage was increased nearly 41% over three years beginning before the panic began, from $5.15 to $5.85 in July 2007, to $6.55 in July 2008, and to $7.25 in July 2009. It is noteworthy that teen employment suffered almost immediately with the first increase in 2007, not reachieving the 2006 peak teen employment level in July of 2007 even as full-time employment hit an all-time record high. Teen employment continued to decline each summer through 2011 before stabilizing at the new low level, averaging about 4.4 million now vs. about 5.9 million previously. Raising the minimum wage has effectively sidelined 1.5 million teenagers permanently.

Raising the minimum wage now in 45% of the country only means inexperienced people like teenagers will find it even more difficult to find that first job going forward.

This is not free-market economics. It is crony capitalism which redistributes income to low-wage-earning adults at the expense of the young.

Call it part of the liberal war on children. Hey, if you forgot to abort 'em, impoverish them!

Healthcare spending through three quarters of 2014 has been only average

Healthcare spending through three quarters of 2014 has been only average, despite what you may have heard about a government conspiracy trying to hide massive spending for political reasons.

Healthcare spending's contribution to GDP in 1Q was -0.16, in 2Q +0.45, and in 3Q +0.52, for an average of three final quarterly reports of healthcare spending on an annualized basis totaling just +0.27 in 2014.

This number is completely within the historical norm for the previous four years, 2010 through 2013, when we had positive contributions of 0.15, 0.28, 0.37 and 0.24, averaging 0.26.

Expect to hear alarm bells sounded again if the 4Q number is high in the first estimate at the end of this month, but you should ignore them. The only proper comparison is with the third and final revision, for which we will have to wait until the end of March 2015.

That's just the way it is.

Wednesday, December 31, 2014

15-year total return from popular Vanguard index funds through 12/31/14 shows bonds beating stocks since 1999 except on the short end

Per annum return per Morningstar tonight:

Total international stock index, VGTSX = 2.96%

Short term bond index, VBISX = 4.05%

S&P 500 stock index, VFINX = 4.13%
Total stock market index, VTSMX = 4.75%

Total bond market index, VBMFX = 5.45%
Intermediate term bond index, VBIIX = 6.52%
Long term bond index, VBLTX = 8.37%

US could join this list of the world's top oil exporters thanks to relaxation of 1974 oil export ban yesterday

Export of up to 1 million barrels per day could put the US in 16th or 17th on this list from the US Energy Information Administration by the end of 2015.

Jobless claims finish December averaging 362,000 per week, 2014 ends at 15.9 million total first time claims for unemployment

All figures are raw, not-seasonally-adjusted.

The 15.9 million figure is now the lowest in the 21st century, beating the heretofore best level achieved under Bush, which was 16.2 million (but when the participation rate of the labor force was much higher than it is today, 66.4% in November 2006 vs. 62.8% in November 2014). Previously I had expected claims to total 15.7 million in 2014, but first time claims for unemployment ramped up a little higher in December than they had been averaging through November.

Here's the historical record:

2001 20.9 million
2002 20.9 million
2003 20.8 million
2004 17.7 million
2005 17.7 million
2006 16.2 million
2007 16.7 million
2008 21.6 million
2009 29.5 million
2010 23.7 million
2011 21.7 million
2012 19.4 million
2013 17.8 million
2014 15.9 million.

Conditions remain very favorable for making continued progress on a recovery of full-time jobs, which are still 3.8 million off their 2007 peak, over seven years ago.

The global oil war just got even more interesting: Dept. of Commerce relaxes export ban

With a tip o' the hat to Andrew Critchlow at the UK Telegraph, Reuters reported just a couple of hours ago that the US Dept. of Commerce has announced relaxation of some parts of the 1974 US oil export ban, here:

(Reuters) - The Obama administration has opened a new front in the global battle for oil market share, effectively clearing the way for the shipment of as much as a million barrels per day of ultra-light U.S. crude to the rest of the world.

The Department of Commerce on Tuesday ended a year-long silence on a contentious, four-decade ban on oil exports, saying it had begun approving a backlog of requests to sell processed light oil abroad. It also issued a long-awaited document outlining exactly what kinds of oil other would-be exporters can ship. ...

... the impending swell of U.S. petroleum into global markets may intensify what many analysts say is a pivotal oil market war, with Saudi Arabia and the Organization of the Petroleum Exporting Countries (OPEC) unwilling to yield ground. Now they will face even greater competition beyond U.S. shores.


Tuesday, December 30, 2014

Alan Greenspan is expecting mediocre GDP in 4Q, says housing and investment must recover to fix it

Quoted here at Bloomberg:

Greenspan said the economy won’t fully recover until American companies invest more in productive assets and the housing market bounces back.

“Almost all of the weakness in the last four, five, six years has been in long-lived investments” in capital goods and real estate, Greenspan said. “Until these pick up, we’re not going to get the kind of vibrant growth that everyone is hoping for.”

Greenspan, who retired from the Fed’s helm in January 2006, said he expects growth to dip below a 3 percent annual rate in the fourth quarter of this year. His forecast is in line with the estimate of 2.5 percent in a Bloomberg survey of economists.


Libertarian Real Clear Markets trots out no less than THREE screeds against housing today


Libertarians really hate the idea that people want to get married, settle down and have children . . . you know, producing future Americans, future tax-payers, well-adjusted, law-abiding, competent future workers. They'd rather have machines they can move around and interchange at will without all the trouble that human beings present. 

Dangerous idiots they are these libertarians, enemies of the permanent things, and of humanity itself.

Good thing no one is paying attention on New Year's Eve Eve.

Norway whacks GDP projection by over 50% amidst plunging oil prices

Seen here:

According to Statistics Norway, lower investment in the oil sector, Norway's primary growth engine, will likely slow the country's overall GDP growth to 1% next year from 2.1% anticipated in September.

The Conservative-led government has not proposed modifications to the current tax levels imposed on the oil and gas sector, where an additional 51 percent income tax rate applies to make the effective rate 78 percent.

Instead, in order to compensate for declining oil revenues, the current right-wing government, made up of the Conservative and Progress parties, has proposed tax reform measures that would significantly alter the distribution of Norway's tax revenues. 


The measure, that would see the tax burden moved from corporate and personal income toward taxes on consumption and property, has been criticized by left-leaning opposition parties.

IEA revises down 2015 oil demand growth by 20%, a third of British oilers in big trouble, mostly smaller

Andrew Critchlow reported Dec. 12th here:

The International Energy Agency (IEA) said on Friday that world demand for oil will grow by 900,000 barrels per day (bpd) next year, a downward revision of 230,000 bpd from its previous estimate.

The Paris-based watchdog now expects world demand to reach 93.3m bpd in 2015. The agency said: "A strong dollar and the lifting of subsidies have so far limited supportive price effects on demand."

And here on the 29th:

A third of Britain’s listed oil and gas companies are in danger of running out of working capital and even going bankrupt amid a slump in the value of crude, according to new research.

Financial risk management group Company Watch believes that 70pc of the UK’s publicly listed oil exploration and production companies are now unprofitable, racking up significant losses in the region of £1.8bn.


Less than 10 years ago $2.29 per gallon was a new high price for gasoline


Monday, December 29, 2014

You could almost say the few people Obama's added to the labor force he's sent straight to the unemployment lines

The lowest jobless claims yet still don't yield the lowest unemployment levels under Bush.

As I pointed out here, jobless claims for 2014 are probably going to finish the year at the 15.7 million level, not-seasonally-adjusted. The comparable year under Bush was 2006, coincidentally also his sixth year in the presidency, when there were 16.2 million similarly measured jobless claims. That's as low as claims ever fell under Bush in absolute terms, and as low as they've been in this century, until now.

So things are better under Obama, right, because claims are going to be the lowest yet this century?

The civilian labor force level was 152.6 million in November 2006, almost 10 million higher than when Bush was first elected, but only 3.7 million higher now at 156.3 million as of November 2014. So claims were 10.6% of the civilian labor force in 2006, and 10.0% of the civilian labor force in November 2014, so yes, things are marginally statistically better, but still very close.

But what's not close is the unemployment rate, or the unemployment level. Not-seasonally-adjusted the rate was 4.3% in November 2006, but 5.5% in November 2014. The civilian labor force has barely grown by 1.7 million after six years of Obama, yet the unemployment level is still 2.05 million higher today than it was in November 2006 when first time jobless claims were at their lowest level before now.

You could almost say Obama sent the few people he's added to the labor force since 2008 straight to the unemployment lines. The other 8 million or more sent themselves straight out of the labor force, never to be counted as unemployed again.

Obama's civilian labor force has only grown 1.7 million since 11/2008, 1.3 million of which came in the last year!

The civilian labor force grew by 1.3 million 11/13-11/14
By contrast George Bush's civilian labor force grew by 11.8 million over his presidency, 6.9 times more than Obama's. To the same almost 6 year point in his presidency Bush's civilian labor force grew by 9.8 million, 5.8 times more than Obama's.

The current year's addition of 1.3 million may be contrasted to the 2.4 million added at the same interval under Bush.

Obama, he sucks!
The civilian labor force grew by 2.4 million 11/05-11/06

2.8x more people left the work force in the last year than did at the same time under Bush

360,000 left the labor force 11/05-11/06
1 million have left the labor force 11/13-11/14
Unemployment comes down faster when you have fewer unemployed people to count.


Sunday, December 28, 2014

Giving USA puts 2013 charitable giving at $335 billion, still in depression from 2007's $349 billion

Seen here:

"At an estimated $335.17 billion, total charitable giving from U.S. individuals, corporations, foundations and bequests in 2013 approached the peak seen before the worst of the Great Recession, adjusted for inflation, according to research released today by Giving USA Foundation and its research partner, the Indiana University Lilly Family School of Philanthropy. ...

"Donations in 2013 increased 4.4 percent (in current dollars) from the revised estimate of $320.97 billion for 2012. Adjusted for inflation, total giving rose 3.0 percent over the 2012 estimate. ...

"When adjusted for inflation, 2007 donations totaled an estimated $349.50 billion."

Jeb Bush pocketed $1.4 million in 2013 working for ObamaCare profiteer Tenet Healthcare of Dallas

So says the LA Times, here:

And on Wednesday, Bush resigned from the board of directors of Tenet Healthcare Corp., also effective Dec. 31, according to a corporate filing. The Dallas-based company actively supported the 2010 Affordable Care Act, and has seen its revenue rise from it, an issue that could draw fire in Republican primaries.

Bush earned cash and stock awards worth nearly $300,000 from Tenet in 2013, according to corporate filings. He also sold Tenet stock worth $1.1 million that year, the records show.

Saturday, December 27, 2014

Dr. Copper has been trading below $3 since before Thanksgiving

Except for a brief ten day period in March, copper hasn't been this low this long since the stock market low in 2009. Combined with oil falling out of bed, the prospects for improving GDP look dim.

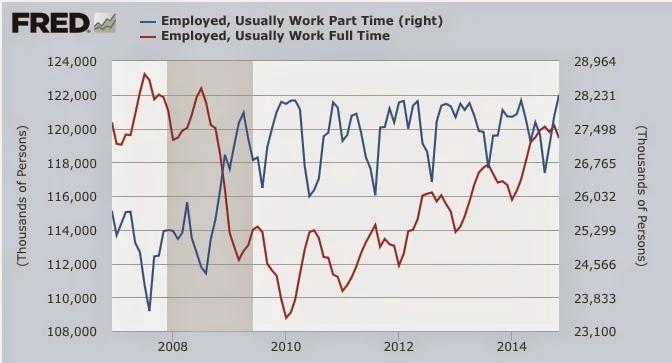
Part-time jobs peak at the end of the year, and full-time jobs peak in the middle of the year

Part-time jobs hit a new all-time high level in November at 28.225 million. This follows a pattern of part-time peaking at Christmas time and full-time peaking around Independence Day. The oscillation between the two is best observed in the not-seasonally-adjusted data.

Thursday, December 25, 2014

If Obama had wanted to "rescue" the economy in 2009, he should have ramped-up the wars as he's doing now

If Obama had really wanted to rescue the economy in 2009, he would have ramped up dramatically the wars in Iraq and Afghanistan instead of putting them on the path to euthanasia. In this sense he was a very bad Keynesian who made FDR spin in his grave.

Of course, that assumes he is smart enough to understand Keynesianism, being raised as a doctrinaire Marxist who was content to bask lazily in the glow of his presidential victory while a bunch of Clinton re-treads did their mediocre best for him . . . recreating HillaryCare. A more sinister interpretation believes that the inattention to the economy was all on purpose, since suppressing the middle class is the main objective of revolutionary leftism faced with successful capitalism almost everywhere. Still others simply chalk it up to Obama's incompetence, just another example of the Affirmative Action Presidency at work.

But I digress.

The simple reason for the need to have ramped up the wars back in 2009 is that the radical stimulus spending called for by the likes of Paul Krugman (3x what Obama ended up spending), who ridiculed the smallness of Obama's stimulus spending plan in The New York Times here, cannot be accomplished quickly through any other department of the federal government except through what we used to call more accurately The War Department. 'There are only a limited number of “shovel-ready” public investment projects — that is, projects that can be started quickly enough to help the economy in the near term,' Krugman wrote at the time.

That's for sure.

Proof of this can now be seen in the GDP numbers in just the last year when ISIS all of a sudden became a threat on the administration's radar screen even though ISIS had been building in the open for years and the administration actually had been warned about it and knew about it.

Federal government consumption had been a net negative subtraction from GDP for each of the last three years, 2011-2013, totaling -0.28 points of GDP for each year on average, and 75% of that came on average from cutting spending on National Defense.

All of that changed on a dime in 3Q2014 when ISIS surged into Iraq. Consumption on national defense suddenly vaulted to +0.69 points of GDP from +0.12 points in 1Q and -0.07 points in 2Q, to the point where defense spending now represents fully 97% of the federal contribution to GDP in the third quarter of 2014, and over 13% of GDP overall. All the current big contributors to GDP come in lower than this except for exports, with which defense spending is tied. 

Only the military can spend large sums of government money quickly in this slow-moving, inertia-plagued bureaucratic state. Future presidents, take note: War is still the father of everything.

Wednesday, December 24, 2014

Our markets closed early today in honor of the birth of Jesus Christ, you rag-headed heathen bastards


Merry Christmas: The world is experiencing the benefits of Western liberty like never before

The Nativity at Night c. 1490
Freedom from want, loneliness, ignorance, danger, disease, discomfort and drudgery.

From Richard Rahn:

As we go into this Christmas week, you should count your blessings that you live in 2014. ...

People in the world live far better today than they did a mere half-century ago. World per-capita gross domestic product is now a little more than $14,000 per year, a little less than where the United States was in 1960 or where the Japanese and United Kingdom were in the mid-1970s (inflation adjusted). In October, the World Bank reported that those living in extreme poverty fell from 36 percent in 1990 to 15 percent in 2011. ...

Read the whole thing, here.

Tuesday, December 23, 2014

Zero Hedge gets ObamaCare spending all wrong, again

The latest screed is here, claiming that healthcare spending is "the reason" behind the surge in Q3 GDP.

From the BEA here, healthcare spending contributed 0.52 points (line 17) to 5.0 GDP, about 10.4% of the total.

Zero Hedge wants to leave the impression there was no single bigger contributor to GDP, which isn't the case at all:

Equipment contributed 0.63 (line 30)
Durable goods 0.67 (line 4)
Pure consumption from defense spending 0.69 (line 55)
Export of goods 0.69 (line 47).

More importantly, it's not like we haven't spent 0.52 points of GDP on healthcare before.

We spent 0.51 in 4Q2011, 0.70 in 1Q2012, 0.48 in 4Q2013, and 0.45 in 2Q2014.

That last one is really important. It's the third estimate final figure of healthcare spending for the immediately preceding quarter, which can now be compared to the third estimate final figure for this one. The difference? Just 0.07 points, for an increase in healthcare spending of 15.5% on an annualized basis from 2Q to 3Q. As I've said, we've seen such increases before, quite apart from any new developments over ObamaCare.

The proper comparison, notably, is with 2Q, not with the previous estimate of healthcare's contribution to GDP for the current quarter, which, like everything else, was admittedly incomplete in the BEA's own words, as is always the case with the estimates before the third and final report.

And what that shows, last of all, is that GDP hasn't "surged" at all between 2Q and 3Q. The only thing which surged is the final revision based on the more complete data. The quarterly measure of GDP is up a very modest 0.40 points, from 4.6 to 5.0, or about 8.7% on the annualized basis. Healthcare's share of that increase to GDP is just 17.5%. 82.5% comes from other categories.

The worrisome thing is all kinds of people read and sometimes quote Zero Hedge: Rush Limbaugh, John Hussmann and Bill Gross come to mind. And Real Clear Markets often links to it, which is how I saw it.

Zero Hedge is embarrassing to read, kind of like pornography.

To date current dollar GDP under Obama is running 9.6% behind Bush every year


Bush nominal GDP increased 43% over his term. To date nominal GDP under Obama is up less than 20%.

Bush nominal GDP rose $4.4338 trillion from the end of 2000 to the end of 2008, from $10.2848 trillion to $14.7186 trillion. That comes to $554.225 billion per year for eight years.

Obama nominal GDP has risen to date $2.8812 trillion from the end of 2008 to the end of 3Q2014, from $14.7186 trillion to $17.5998 trillion to date. That comes to $501.078 billion per year for 5.75 years.

The $53.147 billion difference amounts to a difference of 9.59% on average per year to date.

Total market cap to 3Q2014 GDP ratio falls slightly on third revision . . .

. . . to 1.415 from 1.419.

The ratio was 0.74 at the end of 2008, indicating that the stock market was 91.2% more expensive at the end of September 2014 than it was at the end of 2008.

At rich valuations the return from stocks over the subsequent long haul is surprisingly small. From the peak in August 2000 to now the average nominal return from the S&P500 has been just 4.22% per annum, with dividends fully reinvested. From the peak in October 2007 to now the average nominal return has been 6.35% per annum.

The great bull market from July 1982 to August 2000 produced an average annual return of 18.99%. 

The dollar is trading above 90 today

The dollar is trading above 90 today, for the first time since early 2006.

Third and final revision of 3Q2014 GDP surges to 5.0% on personal consumption and investment revisions

Personal consumption added 2.21 points to today's revision of 3Q2014 GDP at 5.0% while government consumption added 0.80 points. TOGETHER they represent 60% of the total, which again gives the lie to the meme that 70% of the economy is still consumer spending.

Not any more. Frugality is still operative in this economy when only 44% of it is from the consumer side. Keep in mind that that's a one month IMPROVEMENT in the BEA's assessment of the contribution of personal consumption by 46%.

Hm. The difference a month can make.

In the second report a month ago personal consumption had added just 1.51 points, and government consumption 0.76. Personal consumption had been averaging just 1.48 points in contribution in 2011, 2012 and 2013. Government consumption had been averaging -0.45, actually adding a SUBTRACTION to GDP over the same period. The positive contribution from government spending now, however, is nearly 83% defense spending . . . the war on ISIS.

More war, more GDP.

Gross private domestic investment added 1.18 points in today's revision, but only 0.85 in the second. The three year average had been 0.94. The 39% improvement in the estimation for this category is a very healthy and welcome sign for the economy.

Net exports added 0.78 in today's report, unchanged from the second, but way up from the prior period average contribution of just 0.08 points.

Refined petroleum exports, up 3.7% on average in 2014 year to date over the 2013 average. It's a good thing.

Republican enthusiasm for the Line Item Veto began under Reagan and was their version of the imperial presidency

No different than Reagan's enthusiasm for federal mandates like EMTALA, which is the proximate cause of ObamaCare. But J. T. Young doesn't remember it that way, or that far back, here:

'Unmentioned in Obama's legacy is that he killed the line-item veto. While not having done so directly, Obama's presidency has ended this long-time Republican goal just as assuredly as if he had. The political and fiscal role reversals between the Congress and presidency - and between Republicans and Democrats - transpiring for twenty years, have culminated with this administration.

'Twenty years ago, Republicans, armed the Contract with America, dramatically rode to Congressional majorities for the first time in decades. Prominent within that important document was a call for a line-item veto for the president.

'The intent was to give a president power to eliminate wasteful federal spending with pinpoint accuracy. Instead of having to veto an entire bill, and risk shutting down all, or part of the government, a president would be able to stop particular provisions but leave a larger spending bill intact. This authority would reverse the "Hobson's Choice" that prevailed between Congress and a president.'

------------------------------------------------------------------------------

'Ronald Reagan said to Congress in his 1986 State of the Union address, "Tonight I ask you to give me what forty-three governors have: Give me a line-item veto this year. Give me the authority to veto waste, and I'll take the responsibility, I'll make the cuts, I'll take the heat."'


WHATEVER CONSERVATISM IS, IT MOST CERTAINLY IS NOT ABOUT SEEKING TO ACQUIRE MORE POWER BUT RATHER ABOUT SEEKING TO DIFFUSE AND DISTRIBUTE IT, SOMETHING THE CONGRESS DELIBERATELY BETRAYED IN THE 1920s WHEN IT DECIDED TO STOP THE NATURAL EXPANSION OF REPRESENTATION. NO BRANCH OF THE GOVERNMENT MAY BE SAID SINCE THAT TIME TO BE IN ANY WAY CONSERVATIVE IN SPIRIT, EXCEPT IN THE OCCASIONAL IRRITABLE MENTAL GESTURE IN THAT DIRECTION WHICH IS USED AS A CLOAK FOR MORE SELF-AGGRANDIZEMENT. NO ONE ANYWHERE RETAINS "SELF-RESTRAINT" IN THEIR LEXICON.


What waiting over seven years for that full-time job looks like

"Been waiting here that long, eh?"

Terrorism is a feature of Islam, not a bug

"Against them make ready your strength to the utmost of your power, including steeds of war, to strike terror into (the hearts of) the enemies, of Allah and your enemies, and others besides, whom ye may not know, but whom Allah doth know. Whatever ye shall spend in the cause of Allah, shall be repaid unto you, and ye shall not be treated unjustly."

-- Surah 8:60, source of the motto "Be Prepared" of the Muslim Brotherhood, except these Boy Scouts intend to terrify, not to be helpful, friendly, courteous or kind

Sunday, December 21, 2014

Obama says you're better off than when he took office, except you are not

click to enlarge
Obama says, quoted here:

"Like the rest of America, black America in the aggregate is better off now than it was when I came into office."

On the contrary:

Full-time jobs have not recovered to their 2007 peak and won't until summer 2015, if we are lucky. That will be eight years later, when full-time jobs in the past have always bounced back after at most three years in post-war recessions. Obama has done nothing for jobs, except to let the problem fester and try to heal itself.

Health insurance costs much more, covers much less and has narrower and less convenient networks. The proof of this is in the polling, where the majority of Americans remain opposed to ObamaCare. The minority which likes ObamaCare is benefiting from it at the expense of those who don't, who are more numerous. It's called income redistribution. Otherwise known as socialism. You know, like in Cuba, Obama's new best friend.

Owners' equity in household real estate stands at 53.94%, still almost 10% below where it was in 2005. Completed foreclosures in the last month are still running 95% above normal.

More than half of the 66% of Americans who have saved anything for retirement have individually saved less than $25,000. American taxpayers are forced to contribute on average 13.5% to the pensions of the country's government employees and save for themselves only at the rate of 5%.

But perhaps the most damning indictment of Obama is how Americans of all stripes have been impoverished under his watch. Real median household income in the US is lower now than when the recession ended in Obama's first term in 2009, and much lower than when he took office:

"At this point, real household incomes are in worse shape than they were four years ago when the recession ended."

Lies told often enough can become the truth, but they are still lies.

Saturday, December 20, 2014

Amounts allocated for retirement soar to $24.2 trillion in 3Q2014

The Investment Company Institute reports, here.

IRA-type instruments continue to lead the way with 30% of the total amount saved, followed by 401k-type plans holding 27%, and government defined benefit plans at all levels 21%.

The latter figure, representing $5.1 trillion, remains remarkable in view of the fact that the taxpayers have contributed significantly to this sum through taxation, on top of funding their own retirements, or not funding them as the case may be.

As recently as 2011 the national average rate of taxpayer contributions to state employee pension plans, and teacher, police and fire retirement plans combined was 13.5%, according to data reported here by The Buckeye Institute. Contrast that with average annual personal savings rates under Bush of just 4% and under Obama of 6%. And for the most recent 5 months of 2014 the rate has fallen to 5%.

Taxpayers are funding the retirements of government workers at a rate more than double their own, which is one reason why most people haven't saved enough for their own retirements. CBS News reported again just weeks ago here that of the 66% who have saved anything for retirement, the majority have saved $25,000 or less.

Meanwhile, government pension plans, as rich as they may appear from the data, may be underfunded long term by as much as $4 trillion, according to The Boston Globe, here.

With a week left before Christmas, maybe you should make do with what you've spent so far, and put something away for a rainy day. It's a comin'.


Michigan legislators correctly send sales tax increase for roads to the voters

Mlive.com reports the story here.

As I've argued before, here, an increase in the sales tax for road repairs is far less regressive than the gasoline excises as they currently stand, so I support this if I only had various tax increases to choose from. Governor Snyder's plan to raise excise taxes even higher to pay for roads was a non-starter for this reason. Commuters to minimum wage jobs shouldn't have to bear the brunt of a consumption tax on fuel which is at least twice what it is on a roll of toilet paper.

Paying prevailing wages for road repairs under Davis-Bacon laws to union shops, however, guarantees that we pay the highest prices for roads. We shouldn't have to put up with that. Competitive bidding by non-union shops is called for.  

It is also regrettable that the excise tax isn't being eliminated altogether, because, as I've said, it's about twice as onerous as the current sales tax of 6%. That it is actually being expanded somewhat under the bill is moving in the wrong direction. Maybe we can work on eliminating that in future.

Opponents of the sales tax increase should consider whether now is the time to pick a fight with the unions to get better roads at a lower price, and should also lay out what could be cut from the current budget to otherwise accomplish the goal. But the roads have been allowed to get so bad for so long it is difficult to accept the idea that we can afford to wait any longer.

The current compromise may be the best deal for everyone involved.


Michigan legislators cut the baby in half in lameduck twilight, requiring internet sales tax collection from businesses with any form of physical presence

Reported here:

SB 658 and SB 659 extend the state's sales and use taxes to out-of-state companies with a physical "nexus" or presence in the state. That would apply these taxes to companies like Amazon, which has a presence in the state but not a retail front.

A ruling worthy of a rabbi.

The latest snapshot of the asset allocation of the United States is "risk on"

Total bond market per SIFMA through 3Q2014: $38.65 trillion (49.8%)
Total stock market capitalization per ^W5000 right now: $26.07 trillion (33.6%)
Cash per MZM money stock: $12.89 trillion (16.6%)
Total: $77.61 trillion

If you add in Households, Owners' equity in real estate, you add another $10.98 trillion for a total pie of $88.59 trillion, thus 43.6% to bonds, 29.4% to stocks, 14.6% to cash, and 12.4% to real estate.

From the perspective of the Talmud this allocation is very unwise because it is much too light on cash and owners' equity. The amounts allocated to business, to cash and to your homestead should each be about 33%, indicating that we are very heavily "risk on" indeed.

Food for thought.

Vanguard bond index funds, 15 year performance per annum vs. stocks

HMS Vanguard
Per morningstar.com, annual performance 15 years to date for all popular bond index funds beats stocks hands down, except for the short index:

VBISX: 4.05% (short)
VBMFX: 5.42% (total)
VBIIX: 6.48% (intermediate)
VBLTX: 8.30% (long).

Average annual total nominal return from the S&P500, dividends fully reinvested, has been only 4.52% per annum.

That's what happens when stocks are inflated in value over a long period of time, as they have been almost continuously since the late 1990s, except for about four years between 2008 and 2012. And remember, present gains off those lower valuations are already part of the relatively poorer performance of stocks over the last 15 years. It could be much worse.