Tuesday, March 30, 2021

COVID-19 vaccines and Bell's Palsy: Nothing to see here . . . so far

Normal rates of Bell's Palsy in the world range between 100-400 cases per million of population (1-4 per 10,000 / 10-40 per 100,000).

Hong Kong has been abuzz over some cases of Bell's Palsy after Sinovac injections. So far there have been 11 cases from 278,200 vaccinations with Sinovac, which is the equivalent of 40 cases per million of population. But the normal HKG rate is reportedly 230 cases/million.

Similarly in the UK recently the Pfizer vaccine was reportedly responsible for 9.8 cases per million vaccinations, again far lower than the minimum threshold of 100 cases/million.

VAERS data for the US so far shows 81 cases of Bell's Palsy and 420 cases of facial paralysis, for all types of COVID-19 vaccine. Given the vaccination totals in the US so far, you'd have to have 9,500 such cases reported to date just to match the minimum normal rate of 100 cases/million. The US typically has 40,000 cases a year anyway, which is a rate of 122/million assuming population of 328 million.

So . . . nothing unusual is going on anywhere as far as I can tell.

VAERS is rumored to be overwhelmed by a reporting backlog, and there is a relatively small discrepancy between CDC statements of deaths and VAERS data from week to week, but I can't imagine how there would be tens of thousands of Bell's Palsy cases unaccounted for in the reports, which, it must be remembered, can be filed by anyone.

If there were that many they'd be all over the tabloids by now, accusing the government of injury.

Given that the official cause of Bell's Palsy is still debated, it's not implausible that the stress associated with the pandemic in combination with vaccination has been a trigger for cases, just as for other reported adverse effects. People faint, shit their pants, any number of things after they get a jab. Stress is also a trigger for death in some instances.

Most cases of BP resolve, but it is important for sufferers to seek immediate medical attention and get treated with a steroid like Prednisone, which seems to speed recovery from the inflammation affecting the nerve in the face involved in the condition.

Johns Hopkins: US COVID-19 deaths hit 550k, case fatality rate is 1.81% vs. ex-USA at 2.30%


Monday, March 29, 2021

Why haven't COVID-19 hospitalizations in the US fallen to the 2020 lows if things are going so great because of vaccinations?

In the University of Minnesota data, here's where we've been so far in March 2021:

3/01: 49,471

3/09: 38,651

3/15: 35,611

3/16: 32,009

3/22: 34,522

3/29: 35,980.

The lows in 2020 coincided with the seasonal changes. We were at about 25k hospitalized both in June and September 2020 at the approach of astronomical summer and fall, respectively. We are at about 10k higher than that with the advent of spring 2021.

Cases in North America, South America, and Europe are troublingly on the rise.


Saturday, March 27, 2021

LOL, Mittens joins Republican squishes Bush 41, Gerald Ford and John McCain in receiving the JFK "Profile in Courage" award

Story.

Mitt Romney voted to impeach Trump.

Bush 41 raised taxes after promising not to ("Read my lips").

Gerald Ford pardoned Nixon.

John McCain sponsored campaign finance reform legislation in 2002, which was partially overturned in Citizens United in 2010.

Romney's award is for Trump's first impeachment, not the second, for which Romney also voted, but I guess the six Republicans who joined Romney the second time are just chopped liver. That took took no courage whatsoever, apparently.

Wednesday, March 24, 2021

Tuesday, March 23, 2021

Nigeria, Kenya and Angola, all of which have widely used ivermectin for years against parasitical disease, all have enviable COVID records compared with their similarly sized counterparts Brazil, Spain and Peru


The constant drumbeat in the US is how coronavirus hurts people of color proportionally more than it does whites, when these African countries which widely prescribe ivermectin have done astoundingly better than their counterpart countries by population in the West, as shown in these case graphs. And Nigeria has the added disadvantage of the three comparisons of being far more densely populated than Brazil but Brazil is 2nd worst in the world for COVID deaths.

Deaths

Brazil v Nigeria: 295k v 2k
Spain v Kenya: 74k v 2k
Peru v Angola: 50k v 0.5k


Real Clear Politics article floats open borders lunatic Mick Mulvaney for new Heritage Foundation president

 Somebody put a fork in it already.

Story.

Friday, March 19, 2021

VAERS update for reactions to the Pfizer COVID-19 vaccine, as reported through March 12, 2021

VAERS update for reactions to the Pfizer COVID-19 vaccine as reported through March 12, 2021


Blindness/1 of 3 categories only: 24

Blurry vision: 175

Chest pain: 516

Chest discomfort: 627 

Cardiac arrest: 88

Deafness/1 of 5 categories only: 38

Tinnitus/ringing, buzzing in the ear: 142

Diarrhoea: 802

Thrombosis/stroke: 52

Spontaneous abortion: 42

Facial paralysis: 262

Death: 633

Unable to breath enough/dyspnoea: 1395

Muscle pain/myalgia: 1548 

Sense losses: touch/hypoaesthesia (878), smell/anosmia (163), taste/ageusia (174)

Swelling: lymphatic/lymphadenopathy (579), lips (231), throat/pharyngeal (210), face (289), tongue (235), peripheral (322)

Severe itching/pruritus: 1106

Rash: 1099

Hives/urticaria: 774

Tingling sensations/paraesthesia: 1149

Oral tingling/paraesthesia: 520

Joint pain/arthralgia: 1203

Pain in extremities: 1803

Tightness of throat: 387

Anaphylactic reaction: 181

Fever/pyrexia: 3052

Headache: 4467

Johns Hopkins: 540k dead of COVID-19 in the US


Well, I found one guy with the temerity to point out what a phony baloney plastic banana good time rock n rolla Rush Limbaugh was on immigration

From a good thread discussing possible replacements for Rush Limbaugh.

Commenters get it that playing reruns hosted by loyalists ain't gonna cut it.

Cumulus Media's Westwood One is challenging the time slot of Rush Limbaugh with Dan Bongino.

That should force EIB's hand to up their game.

Meanwhile under George W. Bush, Rush Limbaugh licked his finger, checked the wind, and said what he said. Which was Rush's typical behavior. As Rush told 60 Minutes, he was there to see how much money he could make advertisers pay to be on his show. That meant keeping and growing a Republican audience. Rush was never about principle. He was just about convincing you that he was in order to keep you listening.


Monday, March 15, 2021

COVID-19 hospitalizations fell only about 3,000 in the last six days in the University of Minnesota Carlson School data

I'm looking for more like 25,000 total hospitalized before I feel better about this, which was their count last September at the lows before the second wave hit and which crested over the Christmas/New Year period. The equivalent level at The Atlantic at the time was about 29,000.

And how come New York Governor Andrew Cuomo isn't taking heat over being in first place? Again. Huh? Huh? Huh?


Trend for Tanana River Ice-Outs 1917-2020 continues to show them occurring much earlier after 104 years

This is a corrected chart and supersedes all previous iterations. Data in the chart has been double-checked again against printed versions of the data available from the Nenana Ice Classic. One or two dates were incorrectly shown in previous versions of my chart through 2018. 

The overall trend earlier in those charts remains unchanged, however, and has been reinforced by the record-setting early Ice-Out in 2019 on April 14. This is because of the preponderance of relatively earlier Ice-Outs April 30 through May 7, of which there are forty-five. With or without the record early Ice-Out on April 14, 2019 and the relatively early 2020 Ice-Out on April 27, the median date remains the same: May 4. Half the Ice-Outs occur before that date, half after.

Otherwise from April 14-29 there are 27 early Ice-Outs vs. May 8-20 with 32 late Ice-Outs:

April 14-21: 3
April 22-29: 24
April 30-May 7: 45
May 8-15: 29
May 16-20: 3.

Is "global warming" at work?

If you back out all data from the year 2000 onward, here's what you get:

April 14-21: 2
April 22-29: 14
April 30-May 7: 37
May 8-15: 28
May 16-20: 2.

Median date: May 5.

Obviously the biggest impact since 1999 has been on the week April 22-29, adding ten early Ice-Outs, moving the median date earlier by one day after 20 years.

Another thing it does, however, is balance out the data surrounding April 30-May 7, which otherwise was weighted heavier later, with far more Ice-Outs in the second week of May than the last week of April. It could be that over the long course of history prior to 1917 we're missing a lot of early Ice-Outs which recent warming has only now supplied.

For example, we know early 20th century temperatures were warm enough for Roald Amundsen famously to make it through the Northwest Passage from east to west in his small wooden herring ship between 1903-1906. He finally traversed the western half of the Canadian island archipelago during 1905 after being ice bound in the heart of it for two winters. In August 1905 he put in at Herschel Island 5 miles off the north coast of Canada due to ice. From there he skied 500 miles south to Eagle, Alaska, in order to send a message by telegraph wire of the news of his singular achievement. The wire was sent on December 5, 1905. Amundsen spent two months in Eagle before skiing back to his ship and sailing on to Nome in 1906, where his ship then remained until 1972. 

Eagle, AK, incidentally, is about 200 miles due east of the Fairbanks Area, which includes Nenana. The mean average temperature for the Fairbanks Area since 1999 is 28.6 vs. 26.3 1904-1999.

The data for Ice-Outs since 1999 is what it is, evidence of warming.


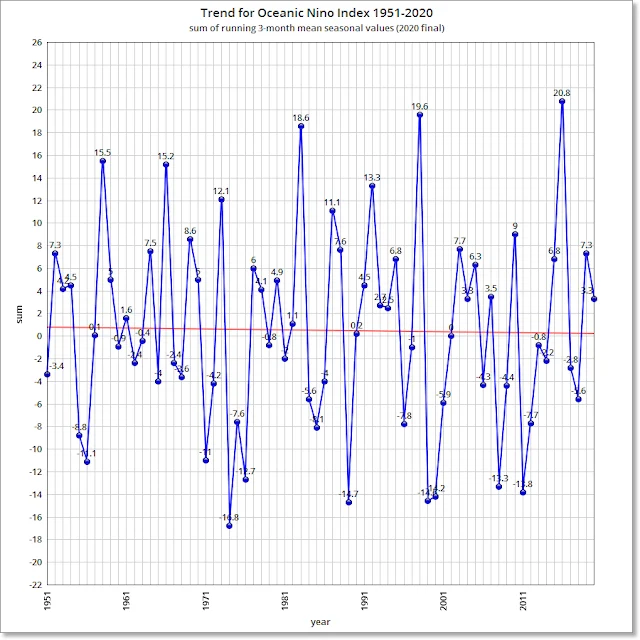
Oceanic Nino Index through 2020 shows slight Pacific Ocean cooling trend since 1951


Saturday, March 13, 2021

Coronavirus cases have been in headlong retreat in the UK and USA since peaking in early January, weeks before vaccination levels became comparable to present day European levels where cases continue to rise

Besides that, new cases also fell dramatically from early January in both Europe and South America before ticking up again after February 15th. Both regions were then and still remain far behind vaccination levels in the UK and USA. There must be some other explanation apart from vaccines why cases fell so precipitously.

Damned if I know what it is, save for "seasonality". But it sure as hell ain't vaccines. The US hit the lackluster present day European vaccination levels in the first week of February, and the UK did the same a week earlier, yet daily new confirmed cases were already in free-fall in both. 

As vaccinations had nothing to do with the drop in cases in the US, UK, Europe and South America in January, it is likewise doubtful their relative paucity in Europe and South America now has anything to do with the uptick in cases since Feb 15.


Psychiatry is such a joke when it's the patient who determines the diagnosis of major depression

Imagine your dentist doing that for a cavity.

Dentist: "Do you feel a hole in your tooth with your tongue?"

Patient: "Yes".

Dentist: "How large is it?"

Patient: "Feels really big".

Dentist: "Well, I'm afraid that one's got to come out".

More than HALF of adults who have been infected with COVID-19 have symptoms of depression, new study finds :

For the study, published in JAMA Network Open, the team looked data from eight waves of surveys conducted between June 2020 and January 2021.

Respondents were narrowed down to 3,904 individuals who said they had been infected with COVID-19 in the past but had since recovered.

They were asked to rank how severe their illness was and if they had any persistent symptoms since testing negative.

All of the participants filled out the Patient Health Questionnaire–9 (PHQ-9), which is a diagnostic instrument used to diagnose mood disorders such as depression.

Patients are asked about their mood or behavior over the last two weeks including whether they've had 'little interest or pleasure in doing things' or have been 'feeling down, depressed, or hopeless.'

Those filling out the survey can choose one of the following 'not at all,' 'several days,' 'more than half the days,' or 'nearly every day,' which are scored from zero to three.

On a scale of zero to 27, people who scored 10 or greater are considered to be moderately or severely depressed.

Of the participants, 2,046, or 52.4 percent, scored high enough to be considered to have symptoms of major depression. 

Friday, March 12, 2021

Trend for annual precipitation in Grand Rapids, Michigan, 1903-2020 is 5+ inches above the mean


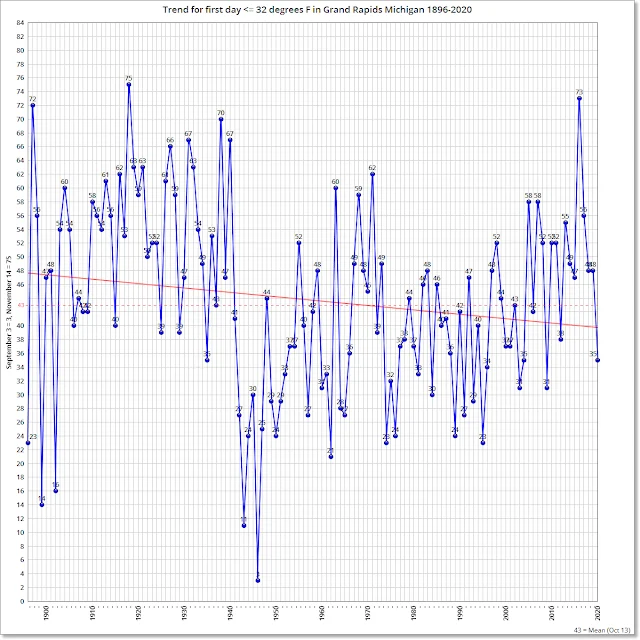
Trend for first day <= 32 degrees F in Grand Rapids, Michigan, 1896-2020 is three days earlier than the mean date October 13


Trend for highest maximum temperature for Grand Rapids, Michigan, 1896-2020 is not quite 1.5 degrees F below the mean


Trend for lowest minimum temperature for Grand Rapids, Michigan, 1896-2021 is 2 degrees F below the mean


Trend for cooling degree days in Grand Rapids, Michigan, is less than 1% below the mean 1904-2020


Trend for heating degree days in Grand Rapids, Michigan, is running about 1.9% below the mean 1904-2020


Trend for average temperature in Grand Rapids, Michigan, is 0.3 degrees F above the mean 1898-2020


Climate Update for KGRR: February 2021

Climate Update for KGRR: February 2021


Max T 48, Mean 50
Min T -12, Mean -2
Av T 20.8, Mean 24.5
Precip 1.84, Mean 1.79
Snow 30.6, Mean 13.3
Heating Degree Days 1231, Mean 1136

HDD to date 4644, Mean to date 4890, season to date 5% below mean

Mean annual HDD 6702, Max was 7712 in 1904 (15.1% above mean, coldest ever), Min was 5253 in 2012 (21.6% below mean, warmest ever)

Feb 2021 was the 30th coldest Feb on record in Grand Rapids, MI, bringing the year to date down to 5% warmer than normal from 9% last month. 

Thursday, March 11, 2021

Johns Hopkins: US COVID deaths reach 530k


Death toll after COVID vaccines climbs to 1,637, CDC denies link


They never got the chance to offer the lifesaving gift. Doctors were doing everything they could to get Kurill stable, but nothing seemed to work. Hawley said his daughter’s liver, kidney and heart shut down. Hawley, who was with his daughter when she died, said it didn’t make any sense. She died, he said, 30 hours after they arrived in the emergency room. ...

“Over 92 million doses of COVID-19 vaccines were administered in the United States from December 14, 2020, through March 8, 2021. During this time, VAERS received 1,637 reports of death (0.0018%) among people who received a COVID-19 vaccine. CDC and FDA physicians review each case report of death as soon as notified and CDC requests medical records to further assess reports. A review of available clinical information including death certificates, autopsy, and medical records revealed no evidence that vaccination contributed to patient deaths. CDC and FDA will continue to investigate reports of adverse events, including deaths, reported to VAERS., the CDC reported on its website.

Wednesday, March 10, 2021

So far very few coronavirus cases from variants have been identified in the US, fewer than 3,500


Current hospitalizations for COVID-19 have dropped by about 11,000 between March 1-9, 2021 in the US


California (blue), Texas (pink), Florida (green), New York (gray)

Examples of US States back-filling death data from COVID-19 in recent days

Data from the following dates looks anomalous in the graphs, way out of proportion to daily experience. This has been a common phenomenon throughout the pandemic. It just sticks out more now. These aren't deaths all actually occurring on the dates indicated. I suspect that with the general decline in cases and deaths, states are both catching up on death investigations as well as finding this to be an opportune time to update the data. But in some states, like Missouri, the practice seems to be quite habitual.

Minnesota: 140 (Mar 9)
Kansas:        73 (Mar 3)
Oklahoma: 167 (Mar 9)
Missouri:    105 (Mar 9)
                   163 (Mar 3)
Virginia:     383 (Mar 3, the crescendo of 12 straight such days)
Ohio:          160 (Mar 9)
                   752 (Mar 5)

Daily new deaths nationwide are averaging 1,597 per day in the first 9 days of March. Sustained over the course of the month that would lead to fewer than 50,000 deaths and make March at the worst the 5th worst month for new deaths.

Daily new cases are averaging 62,914 per day. That would lead to 1.95 million cases if sustained over the whole month and make it at the worst the 5th worst for new cases.

About 18.4% of the population 18 and over has received at least one dose of a vaccine through March 9th. That is roughly 46 million people. That should add big momentum to the case declines, and eventually to the deaths. 

Friday, March 5, 2021

"As of March 3, the CDC has received reports of 97,458 adverse events with 1,381 deaths in people who have taken at least one dose of the approved COVID-19 vaccines"

 COVID-19 vaccine side effects & deaths: The lack of information on how, where to report

The list of adverse reactions to Pfizer's COVID vaccine in the US makes for interesting reading

Some reactions to Pfizer's COVID vaccine reported to US VAERS for 14,649 events through 2/26:


Blindness: 20

Blurry vision: 122

Chest pain: 361

Chest discomfort: 485 

Cardiac arrest: 70

Thrombosis/stroke: 30

Spontaneous abortion: 30

Facial paralysis: 199

Death: 475

Sense losses: touch (671), smell (129), taste (134)

Swelling: lymphatic (362), lips (182), throat (160), face (203), tongue (181), peripheral (206)

Severe itching: 787

Rash: 781

Hives/urticaria: 572

Tingling sensations: 873

Oral tingling: 418

Joint pain: 760

Tight throat: 315

Anaphylactic reaction: 143

Fever: 2,018


https://vaers.hhs.gov/data.html

Full-time employment in the US in February 2021 continues to SUCK

47.5% of the civilian US non-institutional population had full-time jobs in February 2021. The average level in 2020 was 47.3%.

Missing full-time in February relative to the 2019 average of 50.4% is 7.5 million.

Relative to the all-time high in 2000 at 53.6%, missing full-time is a whopping 15.87 million.

The price of gasoline has shot up 32% since Democrat Joe Biden was elected last November


Monday, March 1, 2021

US COVID-19 update through Feb 2021

Daily new cases have dropped dramatically in February 2021, but still average 85,863 per day and remain higher than for any month before last November when the country was still in a fit of hysteria about the pandemic.


Daily new deaths had their third worst month in February 2021 and are still higher than in April last.


Hospitalizations have dropped dramatically in February to 48,871 on Saturday 2/27. Peak Saturday level was January 9th at 130,781. The Saturday peak last summer occurred on 7/25 with 59,301 hospitalized. The Saturday peak last April occurred on 4/18 with 57,761 hospitalized. 

The Covid Tracking Project at The Atlantic will unaccountably stop collecting such data on March 7th. I say unaccountably because the absolute low in Saturday hospitalizations after the April outbreak was 27,967 on June 20th and the October lows never matched that.  We're not even close to those levels yet. It's WAY too early to conclude that data collection should cease when the previous lows haven't yet been taken out. 

Meanwhile, the hospitalization data collected by the University of Minnesota continues to show the second wave still in decline at the end of February. The worst states (NY in gray, CA in blue, TX in pink, and FL in green) for hospitalizations are shown in the graphs. The declines are welcome, but levels remain elevated.

Daily new case data in a number of countries, e.g. Brazil, Finland, Hungary, Czechia, France, Italy, Poland, Ukraine, Sweden, in recent weeks has turned upward to one degree or another. This could be a harbinger of a coming seasonal surge.

Meanwhile about 7.5% of the US is fully vaccinated, and 15% partially vaccinated. 

It remains to be seen how effective the vaccines will be against mutations, and how durable the vaccines will be over time.