Sunday, September 20, 2020

Democrats are squealing like pigs over Cocaine Mitch's supposed Supreme Court hypocrisy, but there isn't any

Americans put Republicans in control of the US Senate again in 2018, with Trump in the White House, so Democrats have no one to blame but themselves for what's about to happen, and Harry Reid in particular for trashing the filibuster rule for judicial appointments.  

From the story here, which explains it all:

The reason is simple, and was explained by Mitch McConnell at the time. Historically, throughout American history, when their party controls the Senate, presidents get to fill Supreme Court vacancies at any time — even in a presidential election year, even in a lameduck session after the election, even after defeat. Historically, when the opposite party controls the Senate, the Senate gets to block Supreme Court nominees sent up in a presidential election year, and hold the seat open for the winner. Both of those precedents are settled by experience as old as the republic. Republicans should not create a brand-new precedent to deviate from them.

Rick Wilson, a Republican who supports Joe Biden and opposes Mitch McConnell, had some amusing opinions about them both in the recent past


Tuesday, September 15, 2020

Meanwhile the trend for the Oceanic Nino Index still shows no sign of long term Pacific Ocean warming


Given urban heat island distortions of +1 to +7 degrees F, average temperature rise of less than 0.3 degrees F above the mean since 1898 in Grand Rapids, MI is suspect

Given urban heat island distortions of +1 to +7 degrees F, average temperature rise of less than 0.3 degrees F above the mean since 1898 in Grand Rapids, MI is suspect (image D).

US EPA Heat Islands page:

"A review of research studies and data found that in the United States, the heat island effect results in daytime temperatures in urban areas about 1–7°F higher than temperatures in outlying areas and nighttime temperatures about 2–5°F higher. Humid regions (primarily in the eastern United States) and cities with larger and denser populations experience the greatest temperature differences. Research predicts that the heat island effect will strengthen in the future as the structure, spatial extent, and population density of urban areas change and grow".

The US Historical Climatology Network station in Grand Rapids, Michigan, looks increasingly compromised by urban heat island effects. It is located at the Gerald R. Ford International Airport (image A), where the main 8,500 foot runway did not become operational until 2001 and where 2 million passengers were not served for the first time until 2004.  

The weather station is located in the northwest corner of the 3,000 plus acre airport grounds at 4899 Tim Dougherty Dr, Grand Rapids, MI 49512 (image B). One can see it is now surrounded by industrial development to the north and west, the airport to the south and east, and a busy county road commission facility right east of the measurement station, which is accessed by a little walkway leading from the National Weather Service building (image C).

The county population has doubled in the last sixty years.

One can observe from the history of maximum temperature at the station (image E) that the trend is clearly lower by nearly 1.5 degrees F from the mean maximum over the whole period. The trend for minimum temperature is even lower, by over 2.0 degrees F from the mean (image F).

Click any image to enlarge.

A

B


C


D
E
F

Sunday, September 13, 2020

The Sweden apologists are still ridiculous: Sweden deaths per million of population might as well be Mexico

Hey, let's hear it for Moldova, huh?

The cop we most need right now


US COVID-19 deaths update through 9/12/20

COVID-19 deaths per day in the entire USA, monthly through 9/12/20:

Mar    138
Apr  1,961
May 1,330
Jun     769
Jul      851
Aug    955
Sep    839 (12 days).

Assuming the current September rate per day through the end of September will mean ~208.6k dead by October 1. Assuming it through the end of the year puts us at ~285k dead by the end of the year.

Consider California as a proxy for the death distribution: 7% of deaths there are aged 0-49, 93% are aged 50+. 19% of deaths are aged 50-64, 74% are 65 or older.

In the 25 worst states for average daily new deaths since the beginning of the pandemic, the week ended 9/12 witnessed 877/day, which is a new low since I began tracking this on July 11, two months ago:

7/11 917
7/18 907
7/25 899
8/1   906
8/8   905
8/15 906
8/22 905
8/29 899
9/5   890
9/12 877.

In the 15 worst states for deaths measured this way, identified in June, the daily average is down 66 over the last two months. In the 10 second tier states for deaths, however, the average is up 26 per day.

One state which has not been in either list is Tennessee, which epitomizes the above noted change in the course of the pandemic. Tennessee started to become a data problem in August, competing with second tier states Missouri and Washington with nine average daily new deaths per day since the beginning of the pandemic.

Now Tennessee is up to eleven as of 9/12/20 whereas Missouri has been flat at nine since the beginning of July and Washington ticked up from eight to nine at the end of July and has been flat ever since. Here's the monthly COVID-19 deaths per day in Tennessee, which shows how August really piled up the numbers there:

Mar 0.41
Apr 6.23
May 5.16
Jun 7.90
Jul 14.51
Aug 21.93
Sep 26.08 (12 days).

Lest we get lost in the weeds, however, the overall picture for the US remains positive with a fourth consecutive week of decline in the compound daily growth rate of deaths measured weekly. It would be best if the deaths just stopped, but at least the growth rate continues to come down . . . for now.


Thursday, September 10, 2020

Wednesday, September 9, 2020

It's been a bumper crop of stupid lately from the PhDs, from Boston University to Hillsdale College

Ibram Kendi of Boston University for The Atlantic completely slaughters the meaning of the traditional Latin motto of the United States, perhaps the most basic thing everyone used to remember from civics classes, and Ben Winegard of Hillsdale College doesn't have the foggiest idea that "contingency" is a philosophical concept derived from Aristotle by way of St. Thomas Aquinas (contingent being), and that Gould is actually arguing against egalitarianism.

You don't have to be Rush Limbaugh to be a big fat idiot these days.

Could be just about anybody, and too often is.

Beware dumbasses . . . everywhere.


Monday, September 7, 2020

I'll bet Kamala Harris loves sweet potato, too

"Sweet Potato Tastes Good. I Like It."

Climate update for KGRR August 2020

Climate update for KGRR August 2020

Max T 91, Mean 92
Min T 52, Mean 47 (tied for 5th warmest low on record with 2018, 2001 and 1938; 1900 and 1939 are tied for warmest minimum at 56)
Av T 72, Mean 70.3
Rain 2.6, Mean 3.07
CDD 228, Mean 189
Cooling Degree Days, season to date 793, Mean to date 615


Hillsdale College "conservative" repeating stupid about COVID


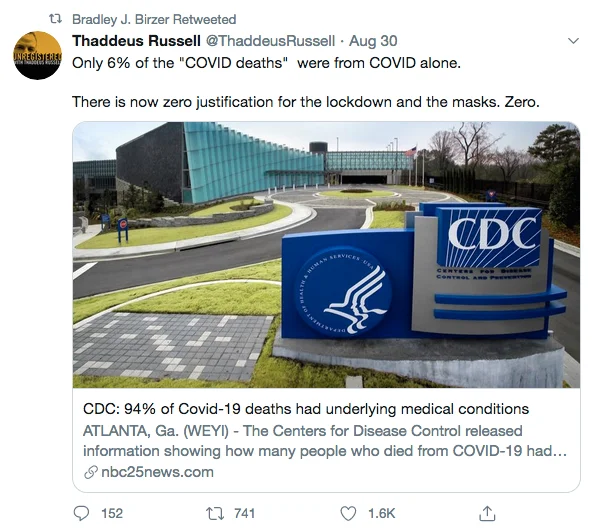
BREAKING: AIRLINER WITH 167 ABOARD CRASHES IN ATLANTIC, KILLING ONLY 10 . . .


THE OTHER 94% DIED OF HEART DISEASE, CANCER, DIABETES, OBESITY, DROWNING, AND SHARK ATTACK. -- The New York Postmortem

Sunday, September 6, 2020

Despite having below average growth rates for Covid deaths over the summer, New Jersey, New York, Illinois, Massachusetts and Pennsylvania all made the top ten list for deaths contributed


Top US states for COVID-19 deaths added Memorial Day weekend to Labor Day weekend:

TX 12,138
CA  9,940
FL  9,578
*NJ  4,904
AZ  4,408
GA 4,048
*NY 3,679
*IL  3,588
*MA 2,812
*PA 2,716
SC 2,452
*LA 2,352
OH 2,300
NC 2,150.

The compound daily growth rate for US COVID-19 deaths weekly has hit a new low

But don't be fooled.

Deaths per day measured on a monthly basis continues to rise after bottoming in June:

Mar    138
Apr  1,961
May 1,330
Jun     769
Jul      851
Aug    955
Sep    987 (5 days).

Total deaths added between Memorial Day weekend and Labor Day weekend from all states came to 91,350. That's equal to more than 94% of the deaths added until May 23.


Hard hit states NY and NJ from the beginning of the pandemic continue to feature prominently in the list of states adding the most deaths over the summer, if not in the headlines. While everyone was crowing about how bad Arizona was, New Jersey and New York were still in the top 10 contributing deaths, along with Illinois, Massachusetts and Pennsylvania. Georgia made headlines for political reasons (Republican governor) while California did not.

TX 12,138
CA  9,940
FL  9,578
NJ  4,904
AZ  4,408
GA 4,048
NY 3,679
IL  3,588
MA 2,812
PA 2,716
SC 2,452
LA 2,352
OH 2,300
NC 2,150.

We remain on track to post nearly 300k dead by the end of the year.


Friday, September 4, 2020

If summer death trends continue, expect 235,000 to 241,000 US COVID-19 deaths by the end of October 2020

COVID-19 deaths per day in the US averaged 769 in June, 851 in July, and 955 in August, per the New York Times data I track.

At the average of these, 858 per day, we'll be at 235,811 by the end of October, and 288,149 by the end of the year.

At the August rate we'll be at 241,728 by 10/31 and 299,983 by the end of the year.

Compound daily growth rates measured weekly over the three months show a decline, a rise, and a decline, producing these comparatively modest ascending results. Daily deaths in April averaged 1,961 and 1,330 in May.

Deaths from COVID-19 in the US in 2020 are already the third leading cause of death, ahead of unintentional injuries using 2017 data as a benchmark, and they will stay that way.

Top causes of 2,813,503 registered deaths in 2017: 

Heart disease 647,457
Cancer 599,108
Unintentional injuries 169,936
COPD, other lung diseases 160,201
Stroke, other brain vascular disorders 146,383...
Flu 55,672

More.