Showing posts with label Great Recession. Show all posts

Friday, May 19, 2017

Robert Shiller blames housing bubbles on get rich quick flipper narratives, still completely misses the tax angle

Here, in The New York Times:

There is still no consensus on why the last housing boom and bust happened. That is troubling, because that violent housing cycle helped to produce the Great Recession and financial crisis of 2007 to 2009. We need to understand it all if we are going to be able to avoid ordeals like that in the future.

Ordinary Americans were suddenly able to make a lot of money by flipping their homes because of the tax law changes of 1997. Capital that was previously locked-up in housing by the rules of the New Deal until 1997 was suddenly unleashed to slosh around in the economy when lawmakers gave homeowners the right to avoid most capital gains on the sale of their homes as long as they lived in them only two years. Until 1997, if you didn't buy a more expensive home after you sold yours, you were exposed to a tax hit, unless you took the option of a once in a lifetime exclusion on the gain. The old arrangement had insured, along with the 30-year mortgage, that housing capital built up over a long period of time, creating forced savings for the middle class which could be safely liquidated in retirement without adversely affecting the housing market.

The Republican and Democrat geniuses who ran our government in 1997 changed all that, and within ten years the dang thing blew up. Yeah, I'm talking about you, Bill Clinton, and you, Newt Gingrich.

Too bad Robert Shiller still doesn't get it.

It would probably be unwise to turn back the tax clock now that the damage has been done, but the reinflation of the housing bubble after the crisis wasn't inevitable. The Fed's unprecedented zero interest rate policy has been responsible for that.

When the next housing crash comes, we'll probably not understand it either.

Meanwhile, the median sales price of homes in the aggregate has never been higher, or more unaffordable, and remains the primary driver of wealth inequality in America. 

Sunday, January 29, 2017

Noah Millman at The American Conservative discovers the inverse of "Employment Population Ratio: 25 - 54 years"

Here, excitedly writing about the inverse of this chart which has been around for a long time:


The problem with measuring employment with this chart, or unemployment with its inverse as Millman advocates, is that this cohort (25 to 54 years of age) has been shrinking due to declining birth rates. The meaning it conveys has changed over time for this and other reasons.

Rising birth rates of the Baby Boom until 1964 help explain the dramatic upward movement in the chart thereafter in the first place, along with the entry of Baby Boom women into the workforce at the same time, a second most important variable.

Additionally, at the peak of the Baby Boom in 1957, the birth rate was 25.3. Twenty years later in 1977 it was only 15.1 and has remained thereabouts and even lower ever since.

The lower birth rates have been winding their way through the employment statistics while female employment was peaking at the same time, like the inverse of a goat going through the belly of a snake but undetectable because of the female phenomenon. The peak in the employment population ratio of this cohort notably coincides with the 1957 peak of the Baby Boom hitting 20 years in the workforce in January 1999, shown above. They hit 30 years in the workforce in 2009, right in the middle of the Great Recession.

Ask how many 52 year olds lost their jobs that year (29.5 million of all ages lost their jobs in 2009), and then passed out of the range of this chart within two years, only to be replaced by . . . not enough people born after 1964.

Interestingly, employment for women in this cohort, while still not fully recovered, is off only 600,000 from the 2007 peak, but for men is off 1.8 million, both on an average basis through 2016. That's a deficit of 2.4 million, but based on declining birth rates I'd estimate most of them won't ever materialize in the future . . . because they never existed.

During the Baby Boom between 1946 and 1964, births per year averaged 4.0 million. But between 1965 and 1992, today's 25 to 52 year olds, births per year averaged just 3.6 million per year.

That's 11.6 million fewer people to take up today's slack.

This is probably as good as it gets.

Thursday, January 19, 2017

Laugh of the Day: Jake Novak at CNBC says Obama helped us emotionally recover from the Great Recession

Sure he did, Jake, sure he did.


"President Obama's cheerleading for the economy did help people recover emotionally from the Great Recession."

Thursday, November 17, 2016

Once again Rush Limbaugh is full of it about the late, great recession

Here's Rush on November 15th:

In the first place, this so-called recession, the worst since the Great Depression 2008, I don't care, folks, it wasn't! ... Democrats have lived off of this economic collapse narrative for eight years now, and it's horse hockey. The truth of it is that there hasn't been a recovery from it. ... Hell, the recession that Reagan inherited in 1980 dwarfs this one. I mean the thing that Reagan inherited when he became president in 1980, this doesn't even get close to touching it, how bad it was. ... This has really been a sore spot for me for all these eight years, is how supposedly bad that was and how Obama single-handedly rescued us from it, and it was all the Republicans' doing, and it all happened because of the Iraq war. ... We haven't replaced these jobs that were lost. They keep talking about the employment rate being way down, record lows, what a crock.

Rush doesn't remember the 1980s very well, when he was in his 30s. Without a college education and a long enough personal history to compare things to while experiencing the hard knocks of life trying to get his radio career going, those years understandably seemed worse to him than they really were. Honest people everywhere recognize it was that way for them, too. Unfortunately Rush still doesn't seem to be able to measure the 1980s properly let alone put them in their proper perspective economically.

Take first time claims for unemployment. Reagan's weekly average 1981-1988 was 406,000. Obama's  weekly average 2009-2016 (still unfinished) is 373,000, 8% less severe overall. But the averages around each recession peak are much closer in severity. First time claims 1981-1983 averaged 491,000 weekly, while claims 2009-2011 averaged 477,000 weekly, the latter only 2.85% less severe overall. Peak claims in 1982 averaged 30.1 million, in 2009 only 2% lower at 29.46 million.

While the Obama jobs recession was not quite as severe in terms of the persistence of high first time claims for unemployment, full-time jobs took forever to recover under Obama. Under Reagan they had bounced back almost immediately. In 1981 the pre-recession peak in full-time averaged 83.243 million. By 1984 that level had been recovered with 86.544 million full-time jobs on average. Three years, that's it. In 2007, by contrast, the pre-recession peak in full-time averaged 121.091 million, but it took EIGHT YEARS to recover that level. Full-time finally averaged 121.492 million in 2015. That's why it hasn't felt like things are looking up until this year, in 2016.

If you were an adult in the 1980s, you probably remember the Savings and Loan crisis from 1986-1995, but you probably don't think of the Reagan era as a period of widespread bank failures comparable with what we recently experienced in the Great Recession, and you would be right. Losses from such failures as estimated by the FDIC for the period 1981-1988 total $8.9 billion. But for the period 2009-2016 estimated losses from bank failures soared to $57.3 billion, 544% higher. Even adjusted for inflation the recent losses were well in excess of 200% higher than in the 1980s. 

Or take housing. The Case-Shiller Home Price Index fell at most about 14% from the late 1970s to the mid 1980s through the Reagan recessions. I remember my dad was pretty unhappy about it because he retired in 1980 and was sitting in a house he hoped to sell for more money one day, but the value kept declining. But that was nothing compared to what happened between 2006 and 2012 when the index tanked over 36%. The foreclosure rate averaged just 0.5% in 1980-81, but soared to 3.8% in 2008-09, an increase of over 600% in the rate. Many millions of people lost homes in the Great Recession, but they are nameless and faceless to Rush Limbaugh because to him things were much worse in the 1980s. But not in reality. I saw homes in foreclosure in my own middle class neighborhood in 2007 that I never saw back in 1980 in my dad's hometown.

Perhaps the best way to visualize how much worse the most recent recession was compared with the early 1980s is to examine quarterly current dollar GDP. You had one tiny blip in quarterly current dollar GDP between December 1981 and March 1982 when it declined all of $0.01 trillion, 0.3% that's it. The truth is GDP recovered the next quarter ending June 1982 and never looked back.

Fast forward to 2007-09. There were four quarterly declines: A decline of $0.02 trillion between 12/31/07 and 3/31/08; a decline of $0.29 trillion from 9/30/08 to 12/31/08; a decline of $0.17 trillion from 12/31/08 to 3/31/09; and a decline of $0.04 trillion from 3/31/09 to 6/30/09. The previous peak level in quarterly current dollar GDP wasn't recovered until a year later, in June 2010. It took almost two years, not one quarter as in 1982. All told GDP fell from peak to trough by $0.5 trillion or 3.37%. 

The recession of 1982 was child's play compared with 2007-2009. Rush just can't see it because he was already rich during the Great Recession.

Your guiding light in this time of tumult he is not.   

Sunday, October 16, 2016

Hillary present at the debacles: Housing bubble, Great Recession, Iraq War, Surrender to Iran, Doubling of the Debt, puny GDP . . .

Conrad Black, here:

Hillary Clinton, though she would probably be an improvement on the recent past, represents continuity of what has been the most catastrophic 20 years of misgovernment in American history. She was there, as first lady, senator, secretary of state, or candidate, for the housing bubble and Great Recession, the terrible drain of Middle East war that delivered most of Iraq to Iran and produced a colossal humanitarian tragedy, the doubling of the national debt in seven years to produce one per cent annual economic growth while 15 million people dropped out of the work force, and the terrible fiascoes of the abandoned red line in Syria and the cave-in to Iranian nuclear military ambitions with a fig leaf of (unverifiable) deferral. But she is an able person, still carrying the torch of feminism, and she isn’t Trump.

Monday, October 3, 2016

Hillary's version of Obama's "clinging to their guns and religion": Sanders' supporters are the "children of the Great Recession, living in their parents' basement"

The Intercept has a transcript of a portion of the leaked Hillary audio here:

CLINTON: Some are new to politics completely. They’re children of the Great Recession. And they are living in their parents’ basement. They feel they got their education and the jobs that are available to them are not at all what they envisioned for themselves. And they don’t see much of a future. I met with a group of young black millennials today and you know one of the young women said, “You know, none of us feel that we have the job that we should have gotten out of college. And we don’t believe the job market is going to give us much of a chance.” So that is a mindset that is really affecting their politics. And so if you’re feeling like you’re consigned to, you know, being a barista, or you know, some other job that doesn’t pay a lot, and doesn’t have some other ladder of opportunity attached to it, then the idea that maybe, just maybe, you could be part of a political revolution is pretty appealing. So I think we should all be really understanding of that and should try to do the best we can not to be, you know, a wet blanket on idealism. We want people to be idealistic. We want them to set big goals. But to take what we can achieve now and try to present them as bigger goals.

Monday, December 21, 2015

Scott Sumner is simply an ideologue, and a confused one at that, otherwise he wouldn't be as unhappy as he is

In "Libertarians have nowhere to turn" Scott Sumner the market monetarist laments:

'In my view neither major political party has libertarian inclinations. ... I'm slightly more sympathetic to the progressives who insist that I should really be a Democrat. They tell me "After all, you are rational. You believe in evolution and support carbon taxes and redistribution and think money was too tight during the Great Recession. You are pro-immigration and skeptical of the idea that America is an 'exceptional' nation, which must police the world." Those are all good arguments, but then I start obsessing about economics. After all, I am an economist.'

Apart from completely missing that the Democrat Party is the party of social freedom and the Republican Party is the party of economic freedom, it's rather singular for a self-described libertarian to embrace economic redistributionism so openly (not to mention a draconian form of taxation). To do so betrays a feeling for the left, not the right, which, if libertarians were only honest enough to admit it, has always been their inclination.

Sumner might reflect on the fact that we actually live in a perfect storm of libertarianism, in which economic (and social) actors have been unleashed to be all that they can be. The trouble is, only a few "succeed". The fact that income inequality has reasserted itself to a degree not seen since the gilded age is proof of the basic fact that not all men are created equal. The very best at making money have risen to the top and become enormously wealthy in an environment specifically designed to allow it to happen. The end result of economic libertarianism is that the very best will eventually succeed in hoarding all the goodies for themselves while the rest of us are left to serfdom. The end result of libertarianism is freedom for thee, but not for me.

The same can be illustrated on the social side, where some freak flags fly higher than all the rest. They rise to fame and influence beyond all their fellows in "art", "music", "literature" and "society", if you can call violent, vulgar and obscene Hollywood films, rap, "shady" novels and the Kardashians representative of those categories.

Conservatism, primarily rooted in religion, has historically functioned in society to apply the brakes to keep these actors from getting out of control and acquiring undue influence, whether socially or economically. The left only imagines itself capable of replacing religion's heretofore tempering role, which primarily functioned through willful self-restraint. Hence the efforts to reduce income inequality by force through taxation schemes, which obviously aren't working. On the social side the left has had even less success, except by recourse to venomous speech and conduct codes which meet with little assent and not a little fear and loathing among the many.

Freedom, as currently conceived in all its sterility, is quite literally killing America.

Saturday, November 7, 2015

WaPo Gen Xer drinks climate Kool-Aid, attacks Baby Boomers for causing global warming and running up the $18 trillion debt

spotted headed to Mt. Rushmore

"Boomers soaked up a lot of economic opportunity without bothering to preserve much for the generations to come. They burned a lot of cheap fossil fuels, filled the atmosphere with heat-trapping gases, and will probably never pay the costs of averting catastrophic climate change or helping their grandchildren adapt to a warmer world. They took control of Washington at the turn of the millennium, and they used it to rack up a lot of federal debt, even before the Great Recession hit."

Substitute "liberals" everytime you see "boomers" in the essay and it makes a lot more sense than attacking your parents per se. Instead the author prefers to commit Maoism in "Baby boomers are what’s wrong with America’s economy". 

Meanwhile, exporting good jobs and importing cheap labor were artifacts of the 1960s revolution, advanced by people who were fellow travelers under FDR. The height of the baby boom generation was what, aged 10 in 1967? 

In the end, Jim Tankersley can't add and subtract, but what his father gave him for Christmas in 2012 for his patricidal thesis says it all:

"After I first outlined this argument to my father in 2012, he gifted me an actual lump of coal for Christmas."

Well done, Dad! The earth remains full of coal, especially American earth, ensuring energy independence as far as the eye can see, as well as oil and natural gas and . . . thorium! If only we'll use it. 

It makes more sense to rely on these going forward because they remain so plentiful, employing technologies to make them harmless to human health, invented by smart people from every generation.

But if a Maunder Minimum ensues in 2030, we might not care as much about the health as the warmth.

Sunday, December 28, 2014

Giving USA puts 2013 charitable giving at $335 billion, still in depression from 2007's $349 billion

Seen here:

"At an estimated $335.17 billion, total charitable giving from U.S. individuals, corporations, foundations and bequests in 2013 approached the peak seen before the worst of the Great Recession, adjusted for inflation, according to research released today by Giving USA Foundation and its research partner, the Indiana University Lilly Family School of Philanthropy. ...

"Donations in 2013 increased 4.4 percent (in current dollars) from the revised estimate of $320.97 billion for 2012. Adjusted for inflation, total giving rose 3.0 percent over the 2012 estimate. ...

"When adjusted for inflation, 2007 donations totaled an estimated $349.50 billion."

Friday, December 12, 2014

30 million prime working age Americans 25-54 do not work, and 10 million are men, competing for fewer than 5 million openings

The New York Times reports here:

"As the economy slowly recovers from the Great Recession, many of those men and women are eager to find work and willing to make large sacrifices to do so. Many others, however, are choosing not to work, according to a New York Times/CBS News/Kaiser Family Foundation poll that provides a detailed look at the lives of the 30 million Americans 25 to 54 who are without jobs. ... [S]ome men might choose to describe themselves as unwilling to take low-wage jobs when in fact they cannot find any jobs. There are about 10 million prime-age men who are not working, but there are only 4.8 million job openings for men and women of all ages, according to the most recent federal data."


Wednesday, December 10, 2014

Americans who say they are middle class has never been lower, falling from 53% in 2008 to 44% in 2014

Pew reported here in January:

The nationally representative survey of 1,504 adults conducted Jan. 15-19 found that the share of Americans who identify with the middle class has never been lower, dropping  to 44% in the latest survey  from 53% in 2008 during the first months of the Great Recession.

Friday, September 26, 2014

Bush GDP vs. Obama GDP, same point in their presidencies

GDP under George W. Bush 5.5 years into his presidency was up nearly 35% nominal. Under Obama GDP is up nearly 18%.

Based on that, evidently, Time Magazine's Rana Foroohar is calling Obama's a 3% economy, without mentioning that Bush's was a 6% economy, nor that these figures are nominal as opposed to the generally reported real, inflation-adjusted numbers, here (it's two ways of making the present less intelligible, not more):

"But we’re now in a 3% economy, and I’m writing the same column [as three years ago]. Only this time, the message is more disturbing. Growth is back. Unemployment is down. But only a fraction of the jobs lost during the Great Recession that pay more than $15 per hour have been found. And wage growth is still hovering near zero, where it’s been for the past decade. Something is very, very broken in our economy.

"It’s a change that’s been coming for 20 years."

---------------------------------------------------------------

Yes, wage growth has been flat since 2000. The difference is we still had our higher paying jobs with flat wage growth under Bush, but not now. But that, too, is only nominal. Add in inflation and we are 5.9% behind where we were in 2000, and Obama has done nothing to fix that, either. In fact, it got worse since the so-called recession ended in 2009, 3.1%. And dialing the blame back 20 years to further muddy the waters puts us in year two of the Clinton administration, when Clinton famously broke his promise and raised everyone's taxes, which precipitated one of the biggest and deepest waves of home equity borrowing ever to maintain disappearing lifestyles, helping to gut the basis of the American dream.

But that's not mentioned, either.

That's a lot for a financial journalist not to mention.

Friday, July 4, 2014

Total nonfarm is up 288,000 in June: Why I'm yawning

Unemployment in June falls to 6.1% and total non farm employment is up 288,000, seasonally adjusted, to finish the second quarter. Not seasonally adjusted, the figure is an impressive sounding 582,000 newly employed.

So Q1 GDP at -2.9% is meaningless, right? We're really doing much much better than that number indicates, yes?

That's what fellow traveler Rex Nutting thinks over at MarketWatch in "The payrolls report is right, and GDP isn't". He goes so far as to say that even 2008 negative GDP was meaningless:

"Take, for instance, the first quarter of 2008, just as the Great Recession began. The first estimate of quarterly GDP was 0.6% growth. In mid-2008, that was revised to 0.9%. A year later, however, GDP was revised to a 0.7% decline. The most recent estimate is that the economy shrank 2.7%. It’s madness to think this number means anything."

Spoken like a true believer in the success rate of Soviet 5-year plans. At least "shrank" shows he's educated.

And even John Silvia of Wells Fargo says the jobs report shows "economic growth is far better than the Q1 GDP report indicates".

Oh really? I don't think so. The employment gains aren't telling us anything indicative of a break out to the upside either for jobs or for the economy. To see this you have to stop comparing apples to oranges by comparing monthly change in jobs to GDP which is measured on a quarterly basis.

When you look at the jobs figures on a quarterly basis, you see that total nonfarm always takes a dive in Q1, good economy or bad economy, and it always rebounds in Q2, good economy or bad economy. It tells you almost nothing about the economic trend that in Q2 you always get an increase. So we should expect the jobs numbers to go up in the spring, and they always do. Go all the way back in the not seasonally adjusted data to 1981 and you will see that this is true, in the awful year 1982 when the gain was a lousy 1.0%, and even in the dreadful year of 2009. When 2009 was over there were nearly 30 million first time claims for unemployment, yet between Q1 and Q2 that year total nonfarm went up 138,000, a paltry 0.1% but still completely counter trend. The worst was over. Not.

In 2014 we have just witnessed total nonfarm go up 2.805 million jobs between the end of Q1 and the end of Q2, the most since Obama has been president. But guess what? That's an increase of barely 2.06%. Obama's actually done better, for example in 2011 when the increase was 2.09%, his best Q1 to Q2 gain on record. But we don't point to that number today as a sign of the economy turning around at that time, especially since the measure has been weaker since, and GDP has actually gone negative since.

It's instructive to compare Obama's recent 2.06% quarter on quarter gain with past presidents' records for the same period from winter to spring.

How high was the best record Q1 to Q2 since 1980, for example? You would be surprised that it's barely 29% higher than Obama's best to date. Reagan, of boom fame, holds top spot at just 2.69% in 1984. Clinton comes in second with 2.56% in 1994. George W. Bush comes in third with 2.14% in 2005. Obama comes in fourth in 2011 at 2.09%. And George Herbert Walker Bush brings up the rear in 1989 at 1.92%.

But the best record isn't a very good predictor of economic growth ranking. Best GDP to worst was Clinton, Reagan, Bush I, Bush II, and then Obama (so far), not Reagan, Clinton, Bush II, Obama, Bush I.

The overall jobs record between Q1 and Q2 seems like a better predictor of likely economic growth ranking. Clinton, first for GDP, averaged 2.22% over eight years while Reagan, second, averaged 2.07% for the increase in total nonfarm between the winter and the spring. In third is George Herbert Walker Bush at 1.69% (third also for GDP), followed closely by Obama at 1.68% (last for GDP so far) and George W. Bush bringing up the rear at 1.3% (fourth for GDP).

It's entirely possible that Obama already peaked for jobs increases from winter to spring in 2011. Each of the other four presidents peaked early or mid-term. It would be unusual for Obama to do better this late in his term. And so far he hasn't, and has just two more opportunities to prove me wrong.

Overall Obama has lost his momentum, his aura and his credibility, and his lately shrill tone sounds more like a dying bunny the cat got in the backyard than a statesman presiding over the final years of a successful term. I think that means it's likely Obama's overall jobs performance is going to remain weak, as will his GDP.


Tuesday, May 13, 2014

FiveThirtyEight Economists Assert But Don't Demonstrate Distributional Characteristics Of Great Recession Spending Pullback

I refer to "Why the Housing Bubble Tanked the Economy And the Tech Bubble Didn’t" by AMIR SUFI and ATIF MIAN, here, where they basically blame the spending pullback of the Great Recession on the poorest, most indebted homeowners:

"The poor cut spending much more for the same dollar decline in wealth. This fact is one of the most robust findings in all of macroeconomics, ... It also makes intuitive sense."


Their forthcoming book may show this, but this article surely doesn't.


They present data which tell us about homeowners' housing as a share of their net worth by quintiles, their mortgages as a share of their home values by quintiles, and about the net worth of richest and poorest homeowners. These are useful distributional observations which, unfortunately, in the case of spending are missing in the presentation! You'd think they would be present in a story which attacks traditional economists like Ben Bernanke for ignoring distributional data sets. Ah, yeah.


Apart from whether showing the distributional characteristics of the spending pullback is even possible, I wonder if it makes any sense that the poorest homeowners could cut their spending enough to account for the sums involved, which is what traditional economists wonder. Weren't they the ones primarily represented in the 5.6 million who lost their homes to foreclosure in the first place?

Using November 2007 real retail and food service sales as the baseline ($179.37 billion), the cumulative month to month shortfall from that to November 2012 came to $663.09 billion. Yes, it took five full years for real retail to recover. But the peak to trough decline in real GDP from 4Q2007 to 2Q2009 alone, on the other hand, was $639.2 billion, not even half way through the great retail depression. Retail spending shows only part of the picture.

Which is why it's wrong to imply, as the authors do, that the decline in spending, supposedly linked to the poorest homeowners, explains the Great Recession. It only explains about a third of it, but just how much of that can be blamed on the poorest homeowners remains a mystery.

Tuesday, April 15, 2014

Janet Yellen's Fool's Errand: Finding A Way To Fix What's Supposedly Fixed

Everybody believes the financial crisis is over, but apparently Janet Yellen does not. She's more right than she knows, but that's a sign of something into which angels fear to look. This could be rough.

Quoted here:

Yellen said regulators must focus on ways to prevent another financial crisis. She spoke via video to a financial markets conference sponsored by the Fed's Atlanta regional bank.

"In 2007 and 2008, short-term creditors ran from firms such as Northern Rock, Bear Stearns and Lehman Brothers and from money market mutual funds and asset-backed commercial paper programs," she said. "Together, these runs were the primary engine of a financial crisis from which the United States and the global economy have yet to fully recover."

-----------------------------

Regulators specialize in keeping capitalism from cleansing itself through failure. According to this line of thinking, recessions are personae non gratae, and depression doesn't even exist as a conceptual category of the contemporary period. If one occurs, they call it something, anything, else, as in "The Great Recession". Bankruptcy? Fuhgeddaboutit. Until these are welcomed once again, that is, until reality penetrates into the penumbra of the reigning ideology, the zombie economics of the last 14 years are here to stay, or perhaps worse, and we shall continue to walk in the darkness.

Thursday, March 27, 2014

Obama Is Going To Finish His Presidency With The Worst GDP Performance Since World War Two


The Bureau of Economic Analysis reports here today its third and final estimate of Q4 2013 GDP at 2.6%, up from 2.4% in the second estimate. 2013 overall remains stuck at 1.9%, another paltry sum in the fourth full year after the so-called Great Recession ended.

Obama's average report for the five years 2009-2013 is 1.24%, the worst in the post-war.

Bush's average report at 2.13%, the worst up to the time, was 1.7 times better than Obama's to date.

Even if Obama racks up 3.5% real GDP growth in each of the next three years 2014, 2015 and 2016, he'll still end up with a worse record than Bush and the worst record since World War Two.

What a complete and utter loser.


Wednesday, March 19, 2014

The Federal Reserve Couldn't Hit A Bull In The Ass With A Sack Of Peaches, Let Alone Target The Inflation Rate

The all items CPI had climbed to 219.016 on July 1, 2008 and didn't surpass that level again until October 1, 2010 at 219.024. The deflationary gale of the Great Recession blew for 27 months.

The collapse in prices in the five months from July 2008 through November 2008 was 3.48%, after rising in 2007 by 4.29%, a spread of 7.77 points.

So much for inflation targeting by the Federal Reserve, which couldn't hit a bull in the ass with a sack of peaches.

In 2012 and 2013, despite explicitly targeting the rate at 2%, the Fed could only come up with 1.6% and 1.56% respectively, suggesting that deflationary winds remain a problem.

Monday, March 17, 2014

Like The Size Of The Civilian Labor Force, Average Weekly Hours Have Stopped Their Recovery

Edward Lazear for The Wall Street Journal here has called attention to two months of back to back declines in average weekly hours, using the seasonally adjusted figures.


average weekly hours, not seasonally adjusted, quarterly average
It got me to looking at the not seasonally adjusted figures, which do not show the same thing. In fact, they show that we've been flirting with the 34.3 level quite a bit in 2013, but also even since before the Great Recession, and before ObamaCare and the recent spate of nasty winter weather. But what is interesting is that the quarterly average of the figures shows that we failed to make a new high in average weekly hours last summer, breaking a pattern of ever higher highs in 2010, 2011 and 2012 which had developed after the lows in late 2009, early 2010. You'll also notice a pattern had developed of higher lows in the measure at the beginning of 2011 and 2012,  but broken at the beginning of 2013.


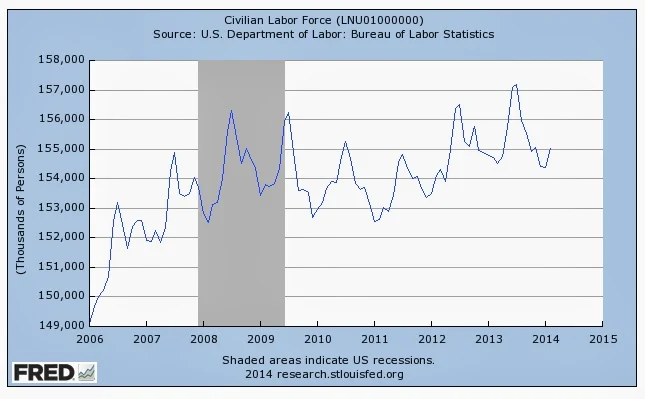
civilian labor force level, not seasonally adjusted
This is interesting because you can see this same pattern in the level of the civilian labor force. The post-recession level bottomed at the beginning of 2011 and made higher lows at the turn both to 2012 and 2013, but not to 2014, which appears to signify more than seasonal shrinkage. Similarly there's been a pattern of ever higher highs in the summers in 2011, 2012 and 2013, but if the pattern doesn't hold in the summer as it hasn't in the winter, we'll not beat the 2013 summer level in the summer of 2014.

It stands to reason that as the civilian labor force recovers and grows, which it has, average weekly hours should rise, which they have, until recently. But the recent weakness in hours probably goes hand in hand with recent weakness in the size of the labor force, not with something else, like ObamaCare or the weather. And that probably has more to do with flagging demand in the economy than anything else.

Monday, March 10, 2014

Louis Woodhill: Premature Signifi-ca-tion

not seasonally adjusted civilian labor force February 2008 to February 2014
Louis Woodhill, here, evidently referring loosely to the seasonally adjusted measure of the civilian labor force level, which is up 523,000 on January 1 and 264,000 on February 1 to 155,724,000:

It was extremely significant that labor force participation continued to move up during February, after its big surge in January. This confirmed that allowing extended unemployment benefits to expire in late December was the right thing to do.

Progressives predicted that limiting unemployment benefits would cause people to drop out of the labor force, but the exact opposite occurred. It turns out that people respond to incentives. Who knew?

Otherwise, I don't know what he's talking about.

The not seasonally adjusted figure was down January 1 and up February 1, more on which below. The seasonally adjusted participation rate was up slightly on January 1 and flat on February 1. Not seasonally adjusted the rate was down Jan. 1 and up February 1.

In the key 25-54 age group, the labor force level is up both seasonally and not seasonally adjusted two months straight: 607,000 and 402,000. That's important because this measure of the vital core of the workforce has been in freefall from the 105 million level reached before the Great Recession. But as it is, the members of this group are still struggling to pop back above 101 million. The deficit in the level of this group's participation is key to a jobs recovery: 4 million people. It's hard to tell why they are back in the labor force in the last two months. It could be their unemployment benefits ended, as Woodhill says. It could also be they've finished new degrees and certifications and have reentered the fray. It could be both of these things, and more.

Not seasonally adjusted, unfortunately, the civilian labor force level still looks troubled to me. Since the beginning of 2011 the level has made three consecutive new highs and two consecutive higher lows, until January 1, 2014 when the low at 154,381,000 fell below the March 1, 2013 nadir of 154,512,000. That broke the pattern of higher lows. At least the level went up on February 1.

The real test is if we make a new high in the summer of 2014 above 157,196,000, the last high and the all time high on July 1, 2013.

Arguably had the Great Recession not intervened, we'd be talking about levels more like 164 million by now. That's how far we still have to go.

Saturday, March 8, 2014

Arguably Obama's 2008 Election Caused All The Job Losses, And We Still Have Not Recovered

total nonfarm employees n.s.a. 1/07-2/14
Arguably the response of business to the election of Obama was outright fear, leading to record job losses. And just as arguably, Obama's class warfare rhetoric has justified those fears. The number one enemy of a communist after all, is a climber. You wouldn't know that of course because the socialist fellow travelers who've taught you and your kids since the 1960s conveniently left that out of the narrative. But that is a separate story.

The fact of the matter is, the so-called Great Recession had already been long in the tooth on election day 2008, and total nonfarm had declined just 2.7 million from its zenith in November 2007 at 139,443,000. But there is really nothing out of keeping for such a large decline given that total nonfarm usually falls off at the end of calendar years. A good example which raised no alarms at the time was in December 1998 when total nonfarm fell 2.7 million . . . in one month.


December 2008 was the worst month on record for t.n.f.
But more people lost their jobs in the first full month following the 2008 election than in any other month in the data series. For a country which supposedly saw Obama as a savior, the response of business was clearly otherwise: nearly 30 million Americans went on to make first time claims for unemployment in 2009 because they lost their jobs in his wake, 13.3 million more than in George Bush's best year 2006 when such claims came in just over 16 million. You can call business a bunch of spineless cowards who took the everyman for himself approach. But isn't that what the healthcare industry did when faced with ObamaCare? Play along to get along, or face the consequences. Few are the fighters for principle who sacrifice themselves for a cause. The only people we have who even make a pretence of doing that do it safely atop places like Berkshire Hathaway (taxes), Apple (global warming), Microsoft (birth control), the Oval Office and the well of the US Senate where no man can touch them.


total nonfarm employees, n.s.a., 2/07-2/14, monthly arrows
The data show that the bottom for total nonfarm did not drop out until December 2008. Nearly 3.7 million Americans lost their jobs in December 2008 alone, the most on record. November 2008 had been only a warning of what was coming. By the end of that month, in which the general election had occurred on November 4, just over a million total nonfarm employees lost their jobs. The dust settled at 135,656,000 on December 1st. Then as December unfolded, the bottom fell out with total nonfarm dropping to 131,965,000. And one year later, despite "jobs saved or created", the February 2009 stimulus, cash for clunkers, TARP and the GM, Chrysler and AIG bailouts, scores of big bank failures and trillions of dollars of cheap loans by the Federal Reserve to all and sundry banks and businesses here and abroad, total nonfarm fell another 4.2 million to 127,736,000.

And where are we today? On February 1, 2014, after 5 full years of Obama, total nonfarm is 136,183,000, barely 200,000 jobs ahead of where we were at this same point in 2007. While the trend has clearly been positive for total nonfarm, with a consistent pattern of higher, if muted, highs and lower lows alternating summers and winters as is typical of the data series, the profile of total nonfarm remains terribly weak.

usually work full time 2/07-2/14, n.s.a.
Consider that those who work usually full time today are 2.7 million fewer in number than at this same point in 2007, the record year for full time jobs and for total nonfarm jobs, despite adding 15 million to the population.


part time for economic reasons 2/07-2/14, s.a.
And while those who work usually part time are up nearly 2.4 million, those working part time for economic reasons remain up almost 3 million, seasonally adjusted, February 2007 to February 2014.

For the last four full years monthly job growth has averaged barely 167,000 new jobs per month. Compare that to a Clinton or Reagan when job growth clipped along at an average of 235,000-250,000 per month for years.

I predict jobs will come back when Obama goes away, unless of course Hillary Clinton becomes president. Right now I can't think of a better candidate to complete the job of eradicating the middle class. She'll burn through them like she does through jet fuel and vodka.