Showing posts with label Ironman. Show all posts

Wednesday, December 26, 2012

Investors "All In" 10/1/07 To 10/1/12 Are Down 1.19% Per Year

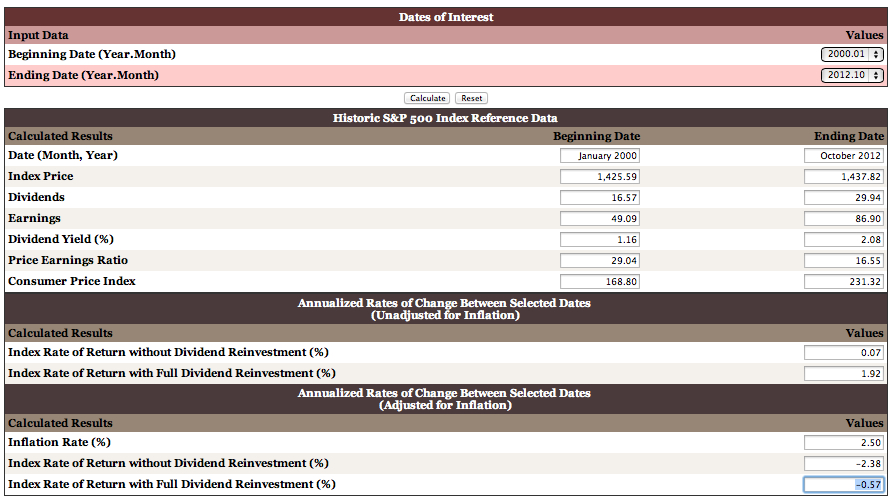
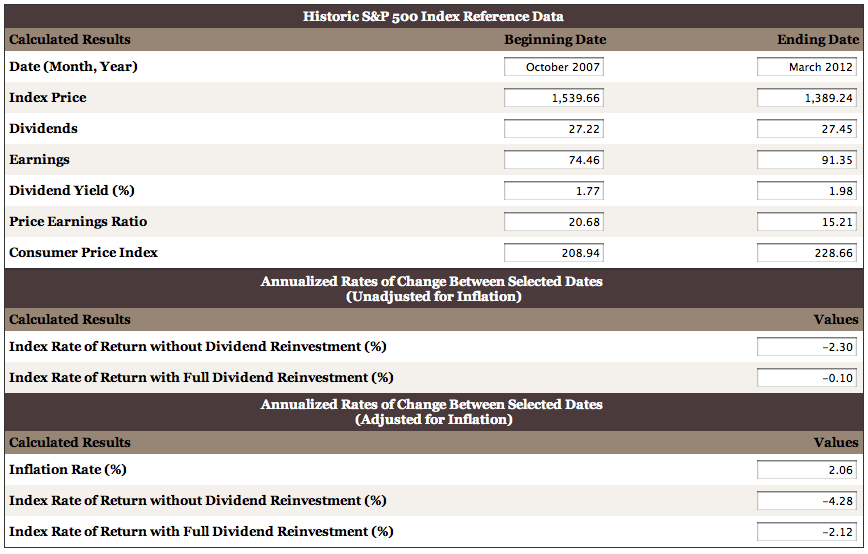
Investors who have remained "all in" the Standard and Poor's 500 Index for the last five years from October 2007 to October 2012 are still down 1.19% per year in real terms, with dividends fully reinvested.

If you've been taking your dividends, say as a retiree, you are down 3.35% per year.

This is pretty grim news when you consider that one school of thought for a conservative retirement drawdown from a portfolio is $40,000 a year, a 4% rate on a $1 million.

If you have been "all in" the SP500 with that sum, which you probably shouldn't be but let's say you are, it is throwing off just about $21,000 in dividend income right now (a little over 2%), so you've got to make up the difference from capital which over the last five years is already posting a 3.35% loss per year. So on top of that 3.35% loss you are taking another 2% per year from the seed corn to make up the difference, meaning your drawdown rate has been really more like 5.35% per annum.

This means that over the last five years such a $1 million retirement portfolio has been plundered by market vicissitudes and the retiree's human necessity by about $268,000. Nothing lasts forever, especially at that rate.

Chart and data here.

Monday, December 17, 2012

Real Rates Of Return, SP500 Index, 1980-2000 v. 2000-2012

Up nearly 13% per annum for two decades v. down 0.57% per annum for twelve years. Ouch!

As shown here.


Real Rate Of Return, SP500 Index, 2002-2012, 4.85% Per Annum

As shown here.

Real Rate Of Return, S&P500 Index, 1997-2012, 2.15% Per Annum

As shown here.

Sunday, December 16, 2012

Your Real Five Year S&P500 Rate Of Return Since October 2007 Is Negative

I've got your real annual rate of return right here. Actually this guy does, but I love showing it. You are down 1.19% every year for the last five years in the S&P500 Index, October 2007 to October 2012.

Buy and hold. Buy and hold. Buy and hold. Buy and hold. Buy and hold. ...

Bye.

Wednesday, December 12, 2012

Growth Of Single Person Households To Blame For Income Inequality

The lesson? Get married and stay married. The tax code is your friend.

As reported here:


Without a corresponding increase in the measured income inequality for U.S. individuals, the increase in the measured income inequality for U.S. households has been almost entirely driven by the increase in the number of single person households over time.

So income inequality among U.S. households isn't increasing because the rich are getting richer. That means that policies intended to right this situation by going after the rich in the name of "fairness" are guaranteed to fail, because the real cause of the increase in income inequality among U.S. households over time is something that cannot be fixed by such actions.

If only the people pushing such policies could see that....

Boosting Minimum Wage 40% Reduces Youth Employment 25%

You talkin' to me?
Way to go, Brownie!

Story here:


In November 2007, teens represented 4.0% of the entire U.S. workforce. In November 2012, teens account for just 3.1% of the reduced U.S. workforce. At this point, jobs that were most likely to have been held by teens are 14 times more likely to have been negatively affected by the employment situation over the past five years than their numbers among the entire U.S. workforce would suggest.

In retrospect, it seems that the U.S. Congress' action to boost the minimum wage by nearly 41% in three stages from 2007 through 2009 without doing anything to boost the revenues of teen employers by an appropriate percentage to compensate them for their higher costs of doing business during this period of time wasn't such a hot idea.

Sunday, September 30, 2012

Two Years From Now Unemployment Will Still Be About 9.1 Percent

So the calculator here.

That must mean 2 years from now Obama will be the president.

Saturday, September 8, 2012

Since WWII, Stocks Have Done Much Better Under Democrats Overall

Doh!
The following table is compiled from data available here.

The results are annualized rates of return, dividends fully reinvested, adjusted for inflation. In other words, these are the real annual rates of return of the Standard and Poor's 500 Index.

Dates for each presidency are marked from November 1 of the year of election to November 1 in the year losing or leaving office. Truman's service before 1948 is excluded since it overlaps the war when he took over from FDR, who died in office. Kennedy's service is combined with LBJ's because Kennedy was assassinated in his third year. Ford's service is combined with Nixon's because Ford never was elected but finished the second term of Nixon, who resigned. Obama's performance is only to July 2012, the last available data.

2008--2012 Barack Obama        12.66 percent
2000--2008 Bush The Younger  -6.12 percent
1992--2000 Bill Clinton             15.27 percent
1988--1992 Bush The Elder      10.76 percent
1980--1988 Ronald Reagan        8.98 percent
1976--1980 Jimmy Carter           2.60 percent
1968--1976 Nixon/Ford             -3.09 percent
1960--1968 Kennedy/LBJ          9.40 percent
1952--1960 Eisenhower           13.54 percent
1948--1952 Harry S. Truman   17.84 percent

Real gains per annum under Democrats have averaged 2.06 percent for their almost 28 years in control of the executive. Real gains per annum under Republicans just .67 percent for their 36 years in control. How the gains were achieved is another matter, but clearly the Democrats have done three times better than the Republicans.

If You Bet On Bush, You Lost Over 6 Percent Per Year In Stocks 11/00-11/08

Obama Investors Have Done Very Well: 12.66 Percent Real Per Year Since 11/01/08

The Obama economy sucks, but the broad market in stocks has done very well for people with the courage to have bet on him starting November 1, 2008.

Even with the market crash in March 2009, the real rate of return in the Standard and Poor's 500 Index has been 12.66 percent per annum, dividends fully reinvested.

See for yourself here.

Sunday, August 12, 2012