Monday, December 24, 2012

Libertarian Spoils Race For Republican In NH-1, Bringing Back Shea-Porter

Here's another race in 2012 which the libertarians helped throw to the Democrats. Democrat Rep. Carol Shea-Porter, defeated in 2010 by a Republican, regained her seat thanks in part to a libertarian in the race in 2012 who bled enough votes from the Republican to put her back in the seat.

The case was nearly the same in NH-2 where the Democrat faced a Republican and a libertarian but won in her own right.

Libertarians view themselves as successful, as having an impact, when they deprive Republicans of their victories. Libertarians suffer from a kind of bipolar disorder which is distinguished by a predominating social liberalism which trumps their economic conservatism and thus manifests itself politically as alliance with Democrats, which is what they really are, if only they went to therapy.

We know whose side the libertarians are on, and it isn't ours.

Follow the label in the footer to see other races libertarians helped spoil for Republicans in 2012.

Republicans need to grow a quatrain and start attacking not just Democrats, but libertarians as well.

Journalists' Guide To Firearms Identification


h/t Scott

Sunday, December 23, 2012

The Greatest Economic Boom Of Our Time Coincided With The Cheapest Gasoline

Arguably the greatest economic boom period of the 20th Century, the period between 1986 and 2000, was fueled, quite literally, by the cheapest gasoline prices on an inflation-adjusted basis since the end of The Great War. Real gas prices during those years in today's dollars ran down from $2.00 a gallon in the mid 1980s to $1.50 by the late 1990s and up again.

Chart and discussion, here.

Say what you will about former Speaker of the House Newt Gingrich's presidential run in 2011-2012, he's the only public figure who has had the vision to understand the imperative of getting the price of gasoline below $2.50 a gallon to gun the economy.

With four more years of a regime which is the enemy of all things fossil fuel, expect little more than idling in the driveway.

Interest Payments On The Debt Are Not Counted As GDP

So says this guy, here, discussing government spending for GDP purposes:


d. Interest paid on government bonds is NOT counted as part of GDP; the argument is that the interest is not usually for a loan purchasing capital equipment, and therefore is not connected to production; whereas net business interest typically is for a loan used to purchase capital equipment and is counted as part of GDP since it is related to production.

Interest Payments On The Debt Continue To Consume GDP Gains

Interest payments on the debt are reported here.

For the 7 fiscal years from 2006 to 2012, interest payments have totaled $2.898 trillion.

GDP has gone from $13.399 trillion in 2006 to $15.811 trillion annualized in the third quarter of 2012 (using BEA and Federal Reserve z.1 Release figures), up just $2.412 trillion, which means we're still in the hole $486 billion after 7 years.

I don't see the so-called money multiplier working too well here. And for all I know, these interest payments are probably double-counted, so to speak, showing up as GDP, so it's even worse than it looks. It's government spending, isn't it?

You can't borrow your way to growth.

Saturday, December 22, 2012

Real Personal Income Still Remains Below The 2008 Peak

Real personal disposable income per capita remains in depression, over 5% lower than it was on May 1, 2008, the all-time high, when it reached $34,641.

As of November 1, 2012 it is at $32,868.

Graph and data here.

Obama is presently swimming the holiday away in warmer climes as his party happily prepares to see your taxes increased on your reduced and stagnating dreams.

Real Retail Sales Still Remain Below The 2006 Peak

Real retail sales still remain below the December 1, 2006 peak of $180.016 billion. The latest report of real retail sales for November 1, 2012 puts them at $178.51 billion.

Graph and data here.

We still remain in a consumption depression nearly six years since the onset despite extending the Bush tax cuts for two years beyond their original expiration date, and despite the first ever emergency reductions to the payroll tax, rolled back 32% for both 2011 and 2012 from 6.2% of each paycheck to 4.2%:

"[F]or the economy as a whole the payroll tax cut amounted to about $112 billion in 2012 – or the equivalent of at least $300 for each person in the US," reports the Christian Science Monitor, here.

Given the 100% propensity to spend everything in a paycheck, the expiration of the payroll tax cut will remove that sum from current retail spending levels. And going back to the Clinton era tax rates in less than two weeks, on January 1, 2013, will mean transferring about $235 billion annually from taxpayers to federal coffers, according the Congressional Budget Office, as discussed here.

Together that's a theoretical annual hit to spending by the American people of nearly $350 billion.

Yet Democrats cry Forward! to these tax rates of the past despite the damage they are likely to cause.

We're not going to get over the hump that way.

Thursday, December 20, 2012

Taki is Old and Stupid for giving Oliver Stone a Pass

Here, where Stalin's crimes get a total pass, of which Taki would surely have been a victim had he lived under him:

"Stalin never trusted the West, but he had no designs on taking us over from the outside."

Which just goes to show one good pass deserves another.

Q3 2012 GDP Revised Up To 3.1% From 2.7% In Third Estimate

Full pdf report from the BEA here.

master of scratch
Since Obama was elected in 2008, the average report of GDP has been . . . 0.93%, still far and away the worst average report on record since World War II.

Wednesday, December 19, 2012

Lefty FDLAction Calls Obama Pathological Liar

Took 'em long enough. They're shocked, I tell you. Shocked.

Get Ready America. Here Are Your New Obama Tax Increases.


These are the tax rates scheduled to take effect on January 1, 2013. The dollar figures shown are the 2001 dollars adjusted for inflation to 2011. Have fun stormin' the castle!


Sen. Manchin Wants To Know Why We Need 30-Round Clips?

To fight back against these when they can't, or won't.

Story here:

“I don’t know anyone in the hunting or sporting arena that goes out with an assault rifle,” Manchin said on MSNBC’s “Morning Joe.” “I don’t know anybody that needs 30 rounds in the clip to go hunting. I mean, these are things that need to be talked about.”

Tax Equality Would Expose The True Horror Of Federal Spending

The true horror of federal spending in America would be understood by everyone if we actually had tax equality, by which I mean if everyone paid the same rate of taxation on all income, regardless of source.

SocialSecurity.gov reports that there were 151,380,749 people in America in 2011 with net compensation of about $6.2 trillion. However, personal income was actually more like $12.95 trillion from all sources according to the Bureau of Economic Analysis. This total probably was distributed to more individuals than the above referenced 151.4 million workers, but that number will be close enough to illustrate the horror I am describing.

Let us assume we tax each person earning income individually, which we do not do presently for conservative reasons, and grant to each person earning income a poverty exception to taxation of the first $11,170, which is the federal poverty guideline for a one person household in 2012. Times the 151. 4 million workers or so, this exempts $1.7 trillion from taxation, leaving $11.25 trillion of personal income in 2011 to be taxed.

In order to generate the $3.8 trillion or so we spent at the federal level in the last year, everyone earning income from whatever source would have to pay a tax rate of 33.8% on that $11.25 trillion in order to have a balanced budget for the year.

I seriously doubt the 47% who pay next to nothing in taxes would be too happy to get that tax bill, but maybe they should, if we truly want to cut government down to size.

Besides, it's only fair.

Rush Limbaugh Repeats The Rich Man's Lies: Middle Class Has "Bulk Of The Money"


Where this is all going to end up, I'm pretty sure -- we'll see if I'm right; won't be too long, maximum next year sometime, maybe two years -- where this is all going to end up is that the middle class is going to get soaked.  The middle class is going to see their taxes go up, and the reason is, that's where the bulk of the money is. 

You could confiscate all the money the middle class has and run the government for quite a while.  Much longer than if you confiscate all the money the rich have.  There's a reason why the rich are called the top 2%.  There aren't very many of them, folks.  They're only the top two, the top 1%.  And the idea that 98% of the country is not going to have a tax increase under this president is absurd.  Everybody is going to see a tax increase under this president, because his objective is to shrink the private sector and expand the government so that the government becomes the primary source of prosperity and benefits for the vast majority of people.


In 2011, the poorest Americans, those making between $0 and $20K, had total net compensation of $501 billion in the aggregate. The so-called middle class, those making between $20K and $75K per year where net compensation aggregates every $5K up the income ladder constitute piles of cash in excess of $200 billion each, had total compensation of $2.9 trillion in 2011.


The income tranches of the middle are what greedy liberal tax-farmers focus on, as do disingenous rich people, because they stick out like a sore thumb, representing as they do the largest individual tranches for ordinary income purposes and constituting an unbroken line of 11 of them just begging to be ogled. See them here for yourself. You will not find any tranches among the so-called rich in excess of $200 billion. But they make a lot of money nevertheless.

Add it all up and everybody making beyond $75K per year in 2011, which includes the upper middle class, if you piled all their net compensation for Social Security purposes together, would total another $2.8 trillion, just shy of the middle's $2.9 trillion.

If you think this proves Rush's point, you would be wrong. Such net compensation isn't all there is to it, not by a long shot. It's much, much more complicated, and obscure, than that. And that's the way rich people like it. If you can't see their income you can't know how rich they are and they can thus escape becoming a target. That's why so many rich people, and their advocates like Bruce Bartlett who want to tax the middle class and deflect taxes from themselves, insist so strongly that they are middle class just like you.

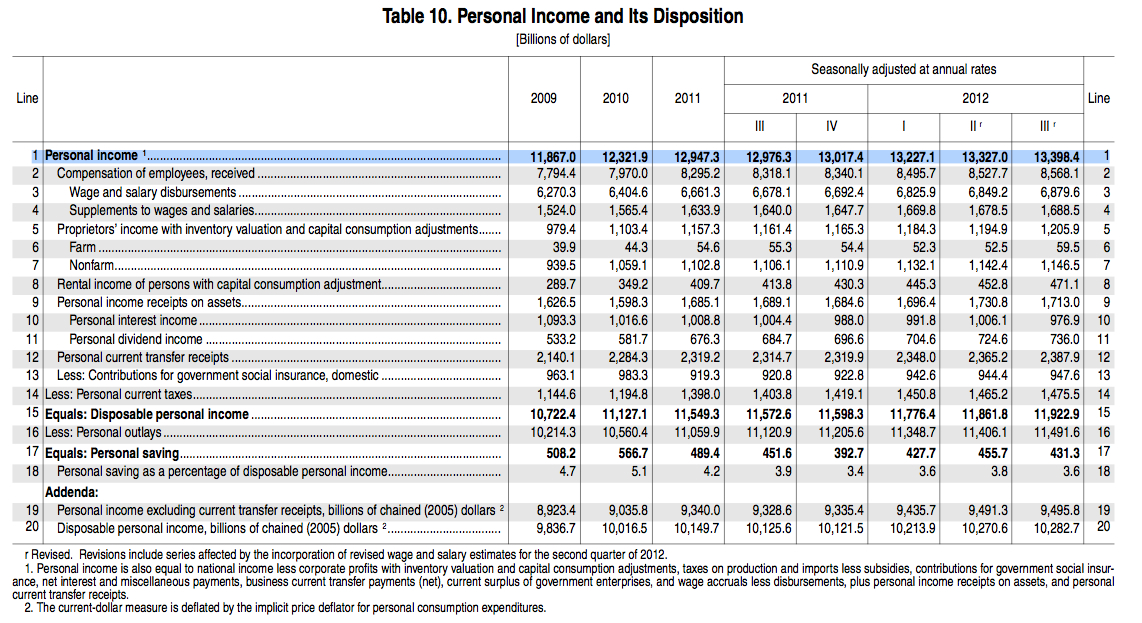
While net compensation totaled about $6.2 trillion in 2011, personal income was more than twice that. The Bureau of Economic analysis, here, reports that personal income was $12.95 trillion in 2011.

People like Jeffrey Immelt, Jamie Dimon, Mitt Romney, Warren Buffett and Bill Gates receive tons of income from stocks, bonds, capital gains, dividends, rents, royalties, et cetera et cetera et cetera, adding at least another $6.75 trillion to that $6.2 trillion in net compensation for Social Security purposes in 2011.

To be sure, lots of people who aren't the very rich receive such income, too, but there is no way on God's green earth that there are enough of them in the so-called middle receiving it to say that the bulk of the money is in the middle. The middle class would like to be receiving the bulk of its income as unearned income like the investor class does, but it doesn't for the most part. It works for its money (unless you're a government employee).

No matter how much the boob with the microphone and the subscription to The Wall Street Journal tells you otherwise, the bulk of the money is not in the middle, most people know it, and that's why Obama is succeeding with his class warfare rhetoric. He has picked his targets, personalized them, polarized them and frozen them, and all the rich can do, because there aren't enough of them, is surrender (Warren Buffett), create diversions (the home mortgage interest deduction flap) or tell lies (The Wall Street Journal).

It really is quite pathetic that we do this to rich people in America and pat ourselves on the back for it. It's actually disgraceful in a country which claims to believe in equal treatment under the law that a wealthier earner is discriminated against because we say he must pay taxes at a higher percentage rate on his ordinary income than a poorer earner must pay. And we feel guilty enough about it that we then turn around and create exceptions to these unjust tax rules when taxing income which is not ordinary. Is it any wonder then that more than half of the personal income in the country has fled for refuge to be classified as other than ordinary? The founders thought a tax was equal only if everyone in the country paid the same amount. This consensus necessarily kept federal taxation low and infrequent because the great masses of people could not afford to pay very much.

The least we could do in homage to that old idea of America would be to tax everyone's income in the country in similar fashion, at one low rate, making no distinctions between the income from a job and the income from an investment. Of course, that would mean a pretty low rate compared to what's exacted today, and would necessitate some pretty drastic cuts to spending. A 10% tax on the personal income of the country of $13 trillion in 2011 would have yielded only $1.3 trillion in revenues, far short of the $3.8 trillion or so we spent.

And that, as we on the right keep saying, is where the real problem lies. Unless we slay the spending monster, there will never be taxation equality in America.

Tuesday, December 18, 2012

Today's Civilian Employment/Population Ratio Was First Achieved 35 Years Ago!

The ratio of employed to population today is 58.7, a level first achieved way back in December 1977.

Persons not in the labor force, that is, persons not counted as unemployed by the federal government, reached an all-time high recently of 88.9 million. Between 1975 when records started being kept and 1992, this number increased by about 0.7 percentage point per year. Under Clinton this number increased by about 1.04 percentage point per year. Under George W. Bush, 1.7 points per year. Under Obama, 2.7 points per year. 


The trend is not our friend.

Monday, December 17, 2012

Obama's Popular Vote Climbs To 50.96%

Monitor it here.

Real Rates Of Return, SP500 Index, 1980-2000 v. 2000-2012

Up nearly 13% per annum for two decades v. down 0.57% per annum for twelve years. Ouch!

As shown here.


Real Rate Of Return, SP500 Index, 2002-2012, 4.85% Per Annum

As shown here.

Real Rate Of Return, S&P500 Index, 1997-2012, 2.15% Per Annum

As shown here.

Gold Has Soared Over 325% Between 2002 and 2012